
Welcome to our EasyCatalog support site.
We help creative designers excel and automate with data driven content.
contact@cunka.com
Creating Tables with EasyCatalog
Preprocessing Table (Using Mustache) NEW
| Preprocessing should only be used on fields that do not update back to a data source, because there is no way of reversing the process. |
Data in the form of JSON/hash style code that appears in an EasyCatalog field, can be easily transformed into a table using the Mustache templating engine.
Mustache can be selected under the "Preprocessing" tab from within the "Field Options" dialog box.
| Preprocessing is done before any additional formatting such as cleansing, prefix, suffix. |
Example - JSON/hash code to HTML Table
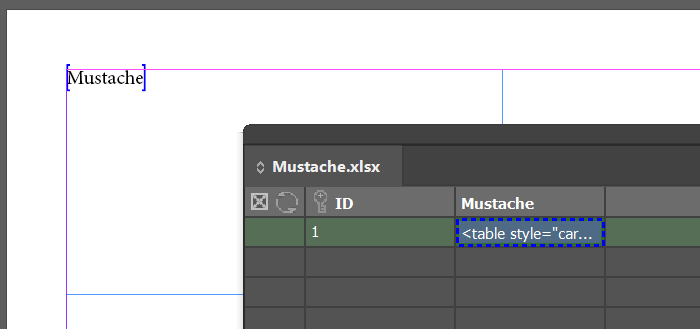
In this example we will look at taking from an EasyCatalog field we have named Mustache, some JSON/hash style code and transforming it with a Mustache template into a HTML table.
The field data is made up of various fields representing the attributes of a car.
{
  "brand": "CUNKA",
  "model": "GT Fast Car",
  "transmission": "Automatic",
  "fuel": "Petrol",
  "capacity", 3342
  "exterior-color":["Solar Red","Crystal White","Battleship Gray"]
}
The field called Mustache has the check boxes for both "Formatted" and "HTML" marked with the "Enhanced" selected.
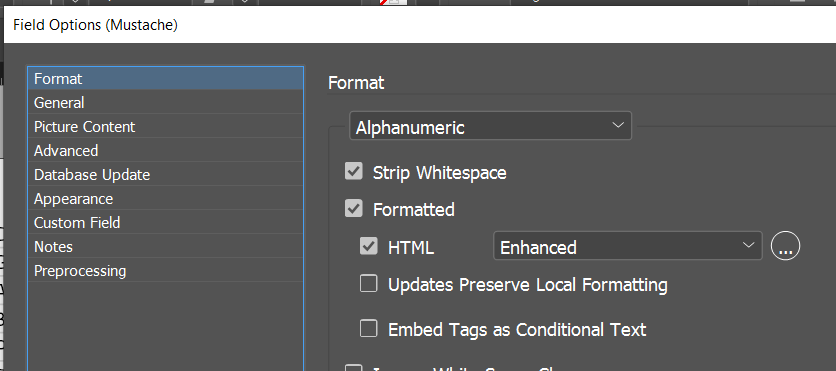
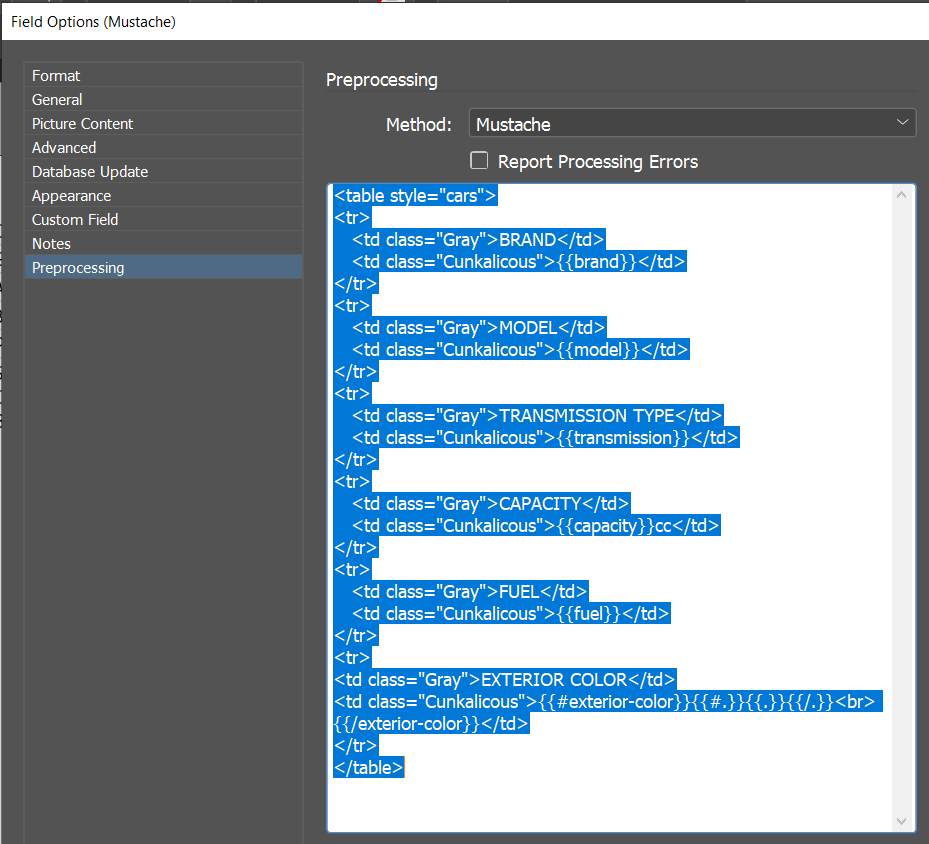
With the "Preprocessing" tab selected the "Method" Mustache is selected. In this area we put our template code to build the HTML table from the fields.
| We have already set up a Table style of "cars" and Cell styles called "Gray" and "Cunkalicous" in our document for the template to use. |
MUSTACHE template coding style
// Place a field in the template
{{FIELD NAME GOES IN HERE}}

e.g. {{brand}}


// Place multiple values from one field
{{#.}}{{.}}{{/.}}

e.g. {{#exterior-color}}{{#.}}{{.}}{{/.}}{{/exterior-color}}
<table class="cars">
  <tr>
    <td class="Gray">BRAND</td>
    <td class="Cunkalicous">{{brand}}</td>
  </tr>
  <tr>
    <td class="Gray">MODEL</td>
    <td class="Cunkalicous">{{model}}</td>
  </tr>
  <tr>
    <td class="Gray">TRANSMISSION TYPE</td>
    <td class="Cunkalicous">{{transmission}}</td>
  </tr>
  <tr>
    <td class="Gray">CAPACITY</td>
    <td class="Cunkalicous">{{capacity}}cc</td>
  </tr>
  <tr>
    <td class="Gray">FUEL</td>
    <td class="Cunkalicous">{{fuel}}</td>
  </tr>
  <tr>
  <td class="Gray">EXTERIOR COLOR</td>
    <td class="Cunkalicous">{{#exterior-color}}{{#.}}{{.}}{{/.}}<br> {{/exterior-color}}</td>
  </tr>
</table>
The field "Mustache" is placed into a text box in our document.
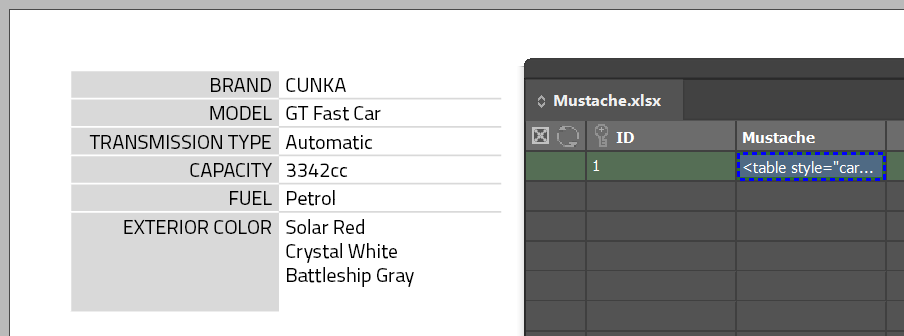
The final result is a nicely formatted table using a JSON/hash source of code.
Standard Table
Using InDesigns built in tables, its possible to quickly build tables from fields.
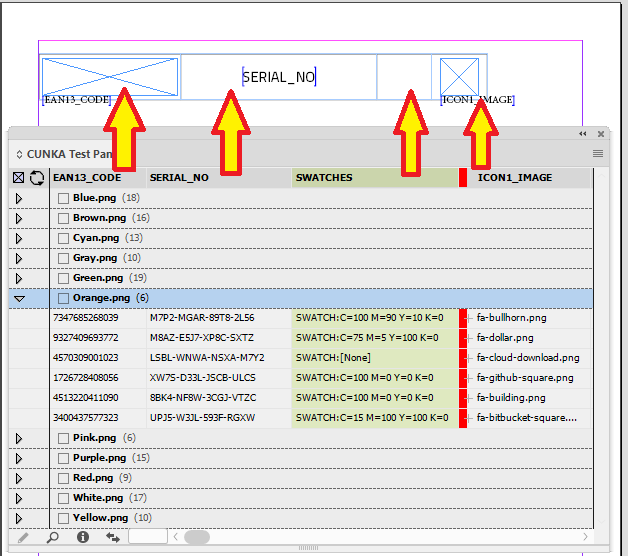
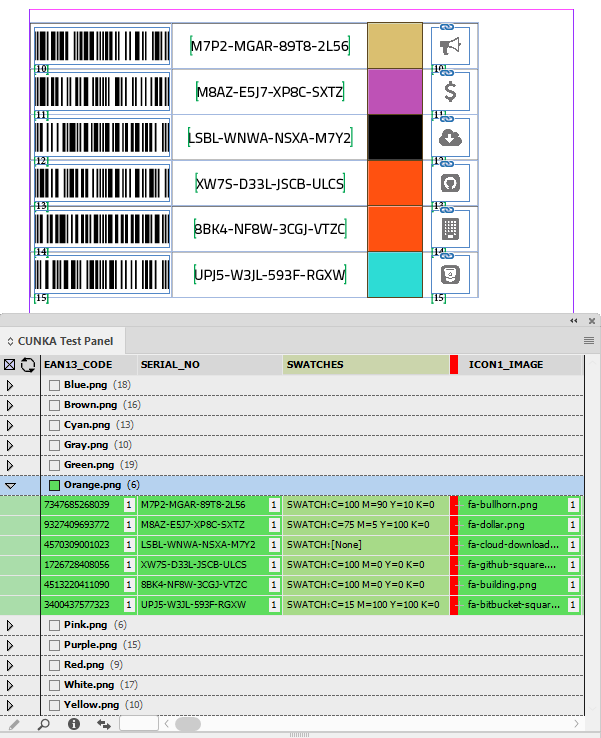
Example - Images and text
This example is a 4 column x 1 row table that will display 1 record.
-
Column 1 is graphic box. It takes a 13 digit number field and turns it into an EAN13 barcode.
-
Column 2 is text - a serial number field.
-
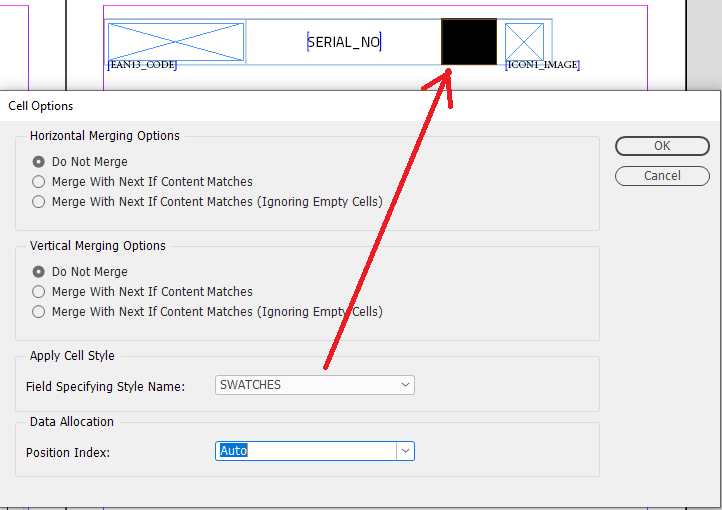
Column 3 is interesting. The cell background style takes a swatches field and applies the color.
-
Column 4 is another graphic box that shows an icon.
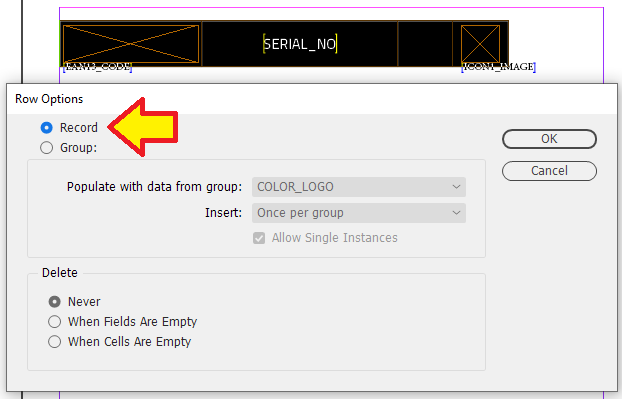
To set the row options select Table → Row Options with the row highlighted.
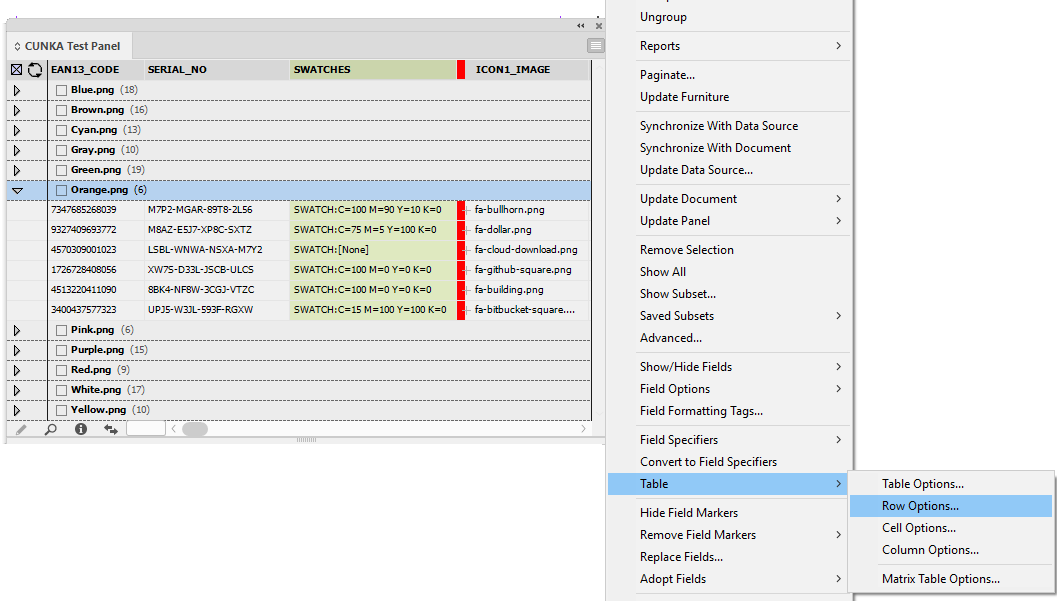
Select Record.
With the cell selected click Table → Cell Options and change the "Field Specifying Stle Name".
This is the final result.
Using FORMATASTABLE
The FORMATASTABLE (Format As Table) custom command can take a delimited text list (usually CSV format) and convert it to a HTML table.
| Also check out the example listed for FORMATASTABLE in our custom command reference. |
Example - CSV to HTML Table
In this example we will take delimited text from a field and convert to HTML table in a custom field using the custom reference FORMATASTABLE.
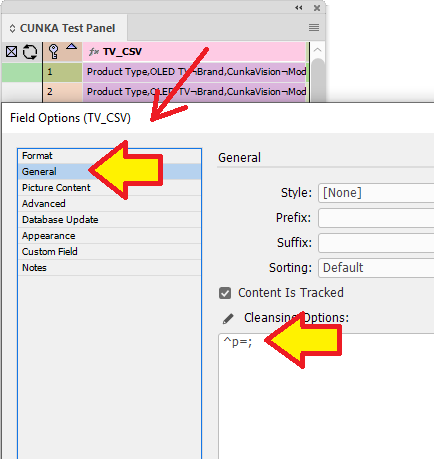
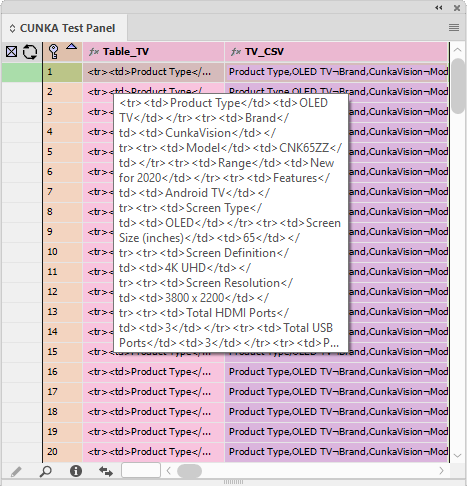
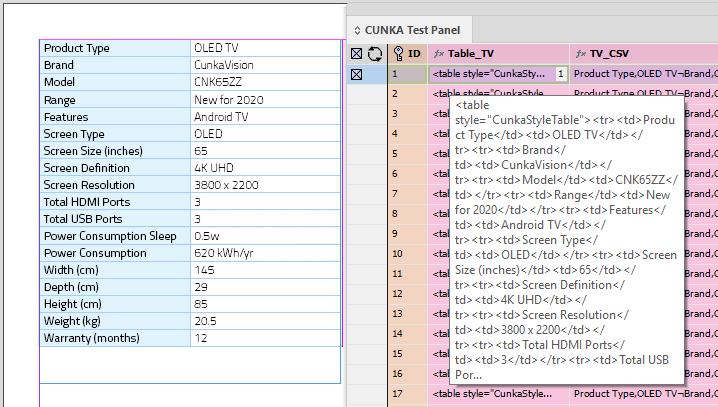
You can see the delimited text (comma seperated) in the field TV_CSV.
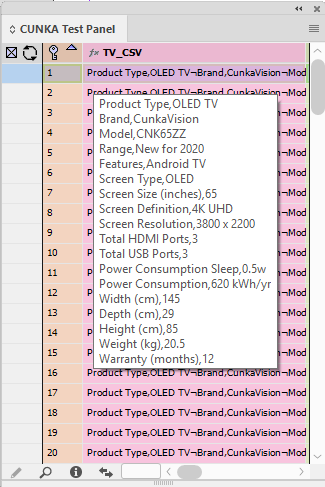
The delimited text field TV_CSV has had some "cleansing" applied to it to remove the paragraph markers.
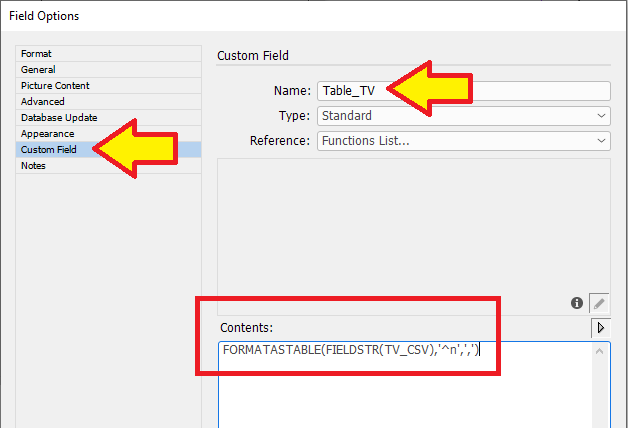
A new custom field Table_TV has been created.
In the Contents: parameter the field TV_CSV field contents are imported, and processed by the FORMATASTABLE command.
FORMATASTABLE(FIELDSTR(TV_CSV),'^n',',')-
"^n" indicates each row ends via a carriage return.
-
"," indicates where each column is located.
The result is table rows (<tr>…</tr>) and table columns (<td>…</td>).
However, it is still not a full HTML table.
To make it a full HTML table, we must use the Prefix: and Suffix: in the field options. While doing that, we can also apply a table style to our final table.
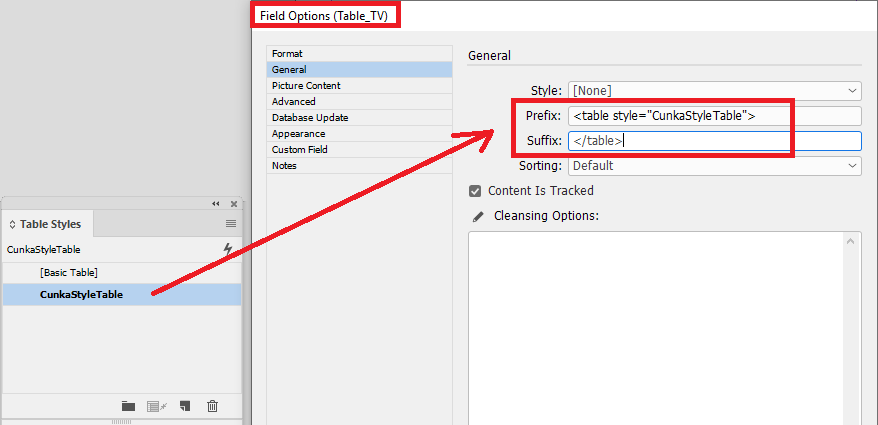
The <table>…</table> tags are now added.
The table style CunkaStyleTable has also been added.
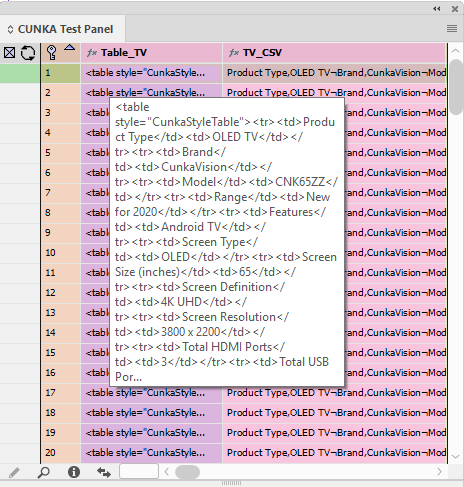
A text frame is added to the document page, and the field specifier Table_TV is inserted into it.
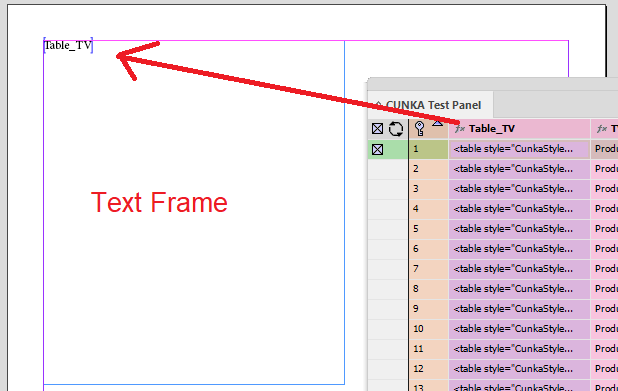
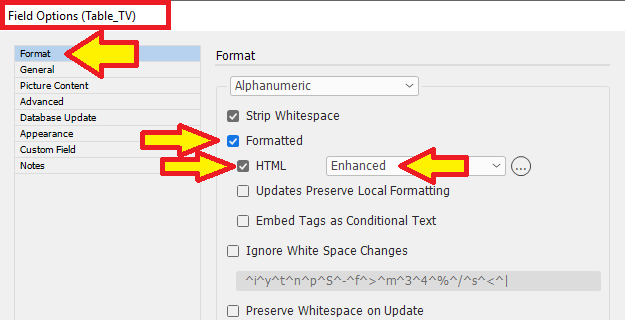
One thing that we have forgotten is set the field options of Table_TV up so it knows the content is HTML text.
The final result shows how FORMATASTABLE has taken the delimited text and created a HTML table, styled and looking nice on the page!
Using APPLYXLST
The APPLYXLST (Apply XSL Transformation) custom command can take a XML snippet and apply a XSL transformation to create a HTML table.
| Also check out the example listed for APPLYXLST in our custom command reference. |
Example - XML/XSLT transformation to HTML Table
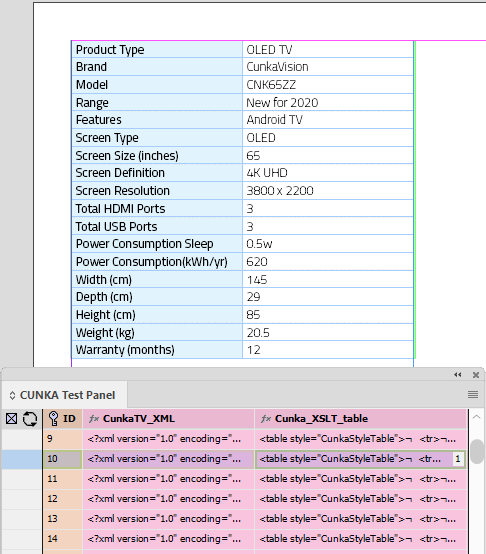
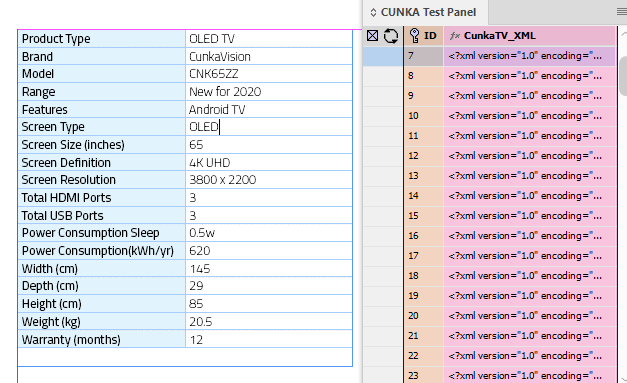
In this example we will look at an existing field called CunkaTV_XML that contains a XML snippet. We will transform the XML with an XSLT stylesheet into a HTML table via new custom field.
Our XML snippet is an example of a product that has a root “cunkaTV” field containing detailed technical specifications about the product.
<?xml version="1.0" encoding="UTF-8" standalone="yes"?>
<cunkaTV>
            <Features attribute1="Product Type" attribute2="OLED TV"/>
            <Features attribute1="Brand" attribute2="CunkaVision"/>
            <Features attribute1="Model" attribute2="CNK65ZZ"/>
            <Features attribute1="Range" attribute2="New for 2020"/>
            <Features attribute1="Features"         attribute2="Android TV"/>
            <Features attribute1="Screen Type"   attribute2="OLED"/>
            <Features attribute1="Screen Size (inches)"  attribute2="65"/>
            <Features attribute1="Screen Definition"      attribute2="4K UHD"/>
            <Features attribute1="Screen Resolution"      attribute2="3800 x 2200"/>
            <Features attribute1="Total HDMI Ports"     attribute2="3"/>
            <Features attribute1="Total USB Ports"         attribute2="3"/>
            <Features attribute1="Power Consumption Sleep"    attribute2="0.5w"/>
            <Features attribute1="Power Consumption(kWh/yr)"          attribute2="620"/>
            <Features attribute1="Width (cm)"    attribute2="145"/>
            <Features attribute1="Depth (cm)"    attribute2="29"/>
            <Features attribute1="Height (cm)"   attribute2="85"/>
            <Features attribute1="Weight (kg)"   attribute2="20.5"/>
            <Features attribute1="Warranty (months)"   attribute2="12"/>
</cunkaTV>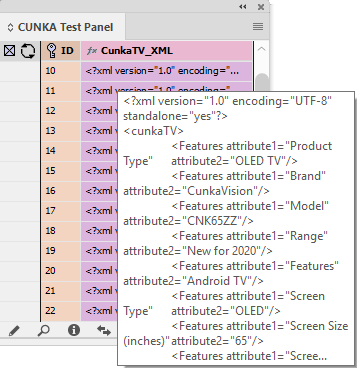
We have an existing XSL style sheet to do the conversion from XML to HTML. The file is called features.xsl.
With the XSL file features.xsl, it is importnant it is stored in a place EasyCatalog and our data source panel can find it.
Within the EasyCatalog "Workspace" folder there is a folder for the data source panel. in this case "CUNKA Test Panel". Within that folder Easycatalog has created a folder called "XSLT". The file features.xsl is saved in the "XSLT" folder.
<xsl:stylesheet version="1.0" xmlns:xsl="http://www.w3.org/1999/XSL/Transform">
<xsl:output omit-xml-declaration="yes" indent="yes"/>
<xsl:template match="/">
<table style="CunkaStyleTable">
  <xsl:for-each select="/cunkaTV/Features">
    <tr>
       <td><xsl:value-of select="@attribute1" /></td>
       <td><xsl:value-of select="@attribute2" /></td>
    </tr>
  </xsl:for-each>
</table>
</xsl:template>
</xsl:stylesheet>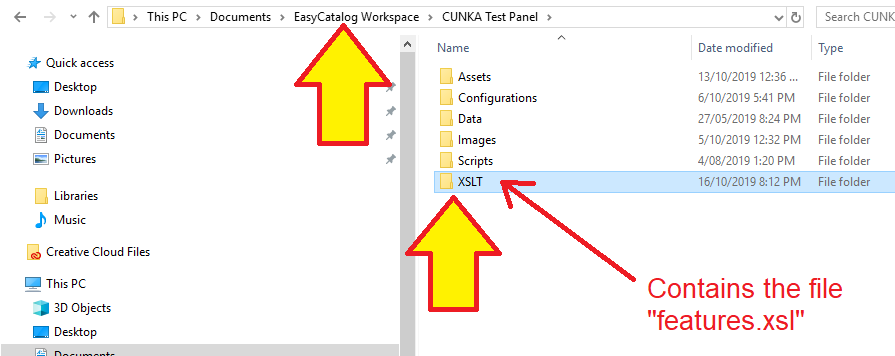
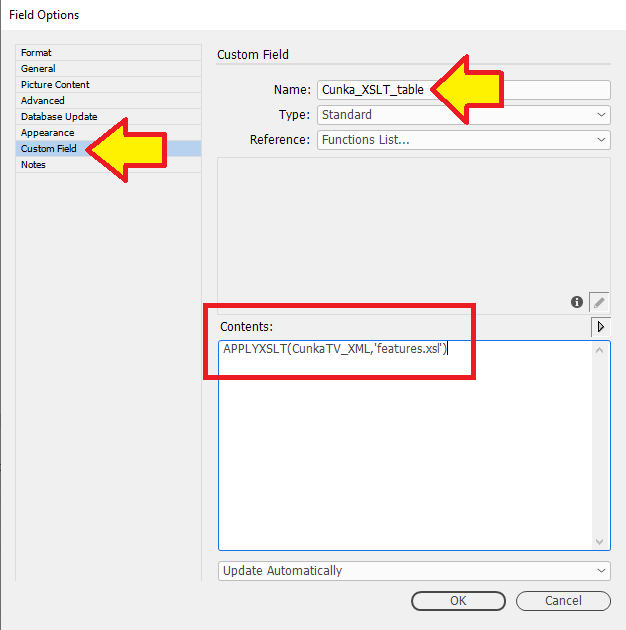
Create a new custom field called Cunka_XSLT_table and put the "Contents:" APPLYXSLT(CunkaTX_XML,'features.xsl')
APPLYXSLT(CunkaTX_XML,'features.xsl')
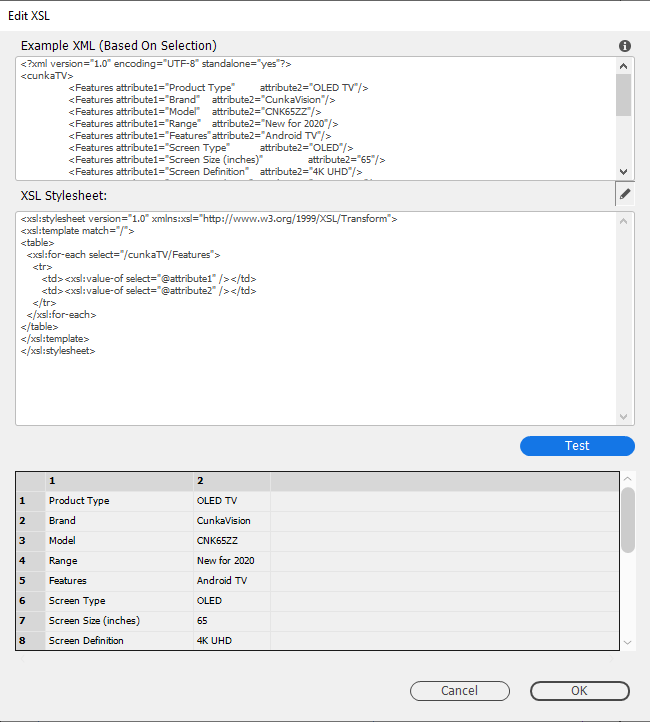
This custom command takes the XML from the field CunkaTX_XML, processes it to HTML using the file features.xsl and saves it in the new custom field Cunka_XSLT_table.
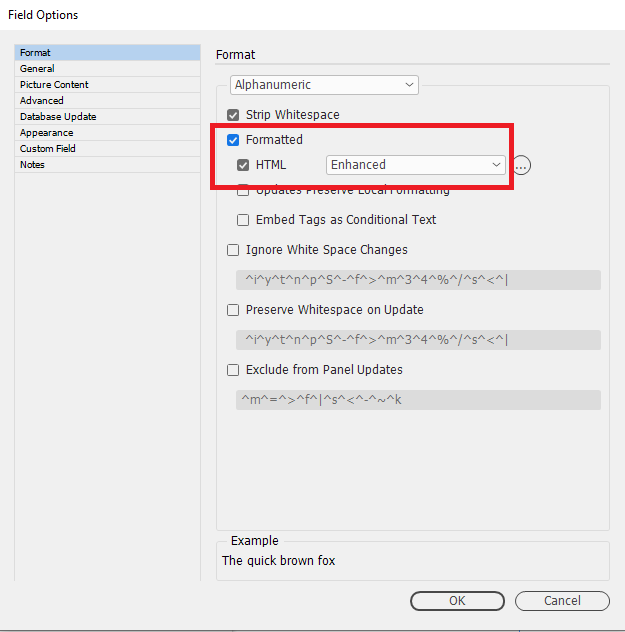
The table will be formatted using HTML style tags, so its important to make sure the field Cunka_XSLT_table uses it properly.
On the "Format" tab make sure the checkboxes for both Formatted & HTML are selected, and the dropdown box is set to Enhanced.
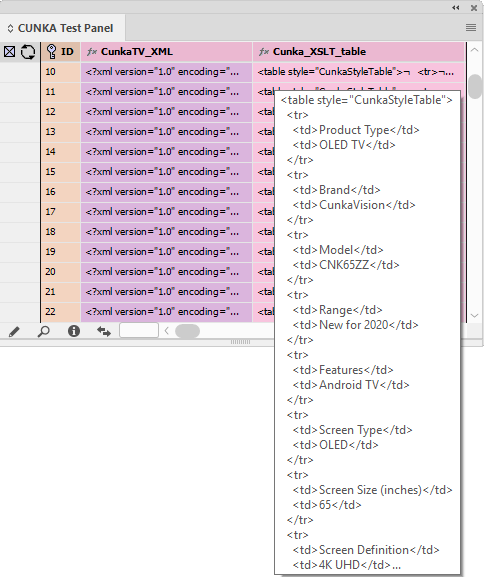
The result shows he new custom field Cunka_XSLT_table and a preview of the HTML formatted table.
Now we add a text frame to a page in our document, and insert the field specifier Cunka_XSLT_table.
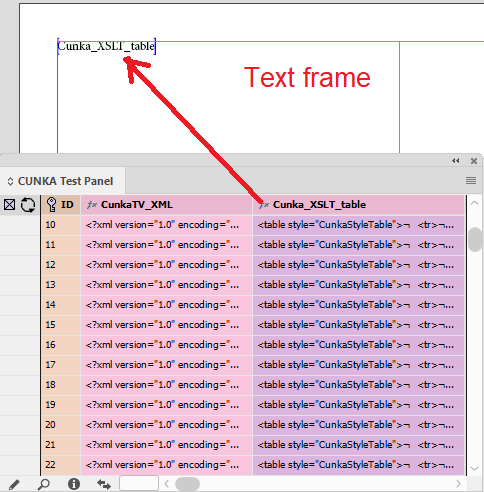
The final result shows when a row is dropped into the text frame, the HTML table appears formatted nicely.
Using TABLEOF (Tabular) Table
Outside of the custom command references, EasyCatalog has its own implementation of the LUA programming language to format data ready for pagination. TABLEOF is an EasyCatalog LUA command that takes fields from records and creates HTML ready tables.
The EasyCatalog command set are designed to complete various tasks and are grouped by class.
For instance, whenever we want to look at all our records, we use the RECORDSET class set. We can grab all the records, or use filter to get only the ones we define, or simply get 1 record. From there we can do things like build a table with commands like tableof.
- Class RECORDSET
-
callback
duplicaterecord
filter
getrecord
new
relatedrecords
removerecord
setfieldcontent
settabular
size
sort
tableof
Example - Using TABLEOF to create a table
In this example, we will create a table using LUA and put it in a tabular table field.
- We will cover
-
-
Getting the records
-
Sorting the records
-
Filter down to the records we want
-
Create a table from the filtered records.
-
Set the column cell styles
-
Set a custom color background for each cell in one column
-
Set column widths
-
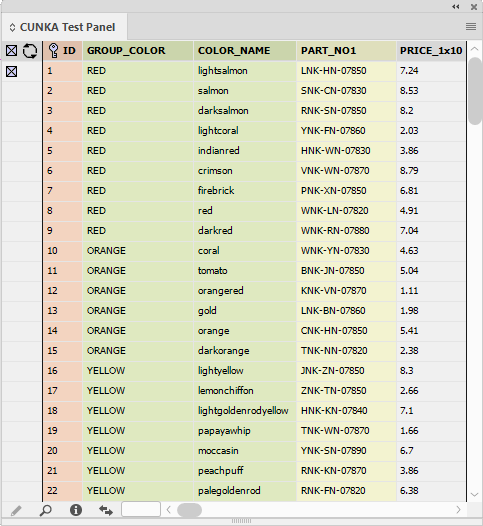
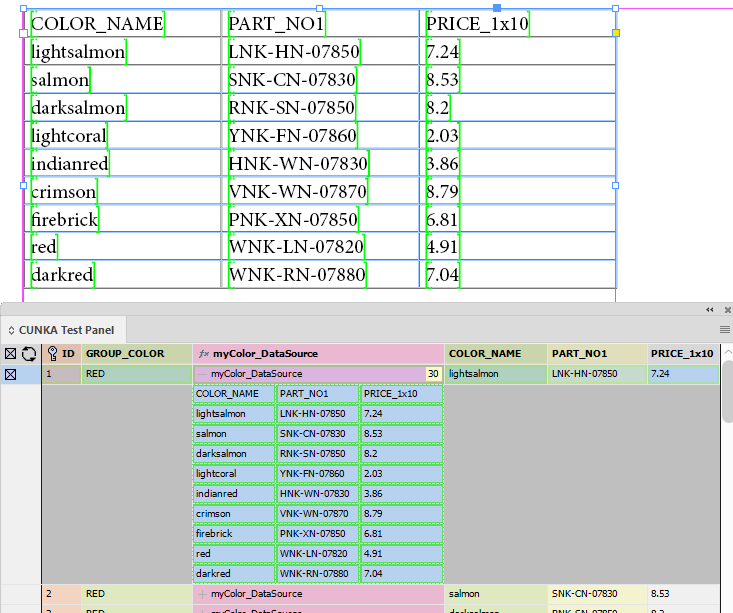
Here is my data source panel called "CUNKA Test Panel".
Our goal is build a a 4 column table from the fields:
-
COLOR_NAME
-
RGB
-
PART_NO1
-
PRICE_1x10
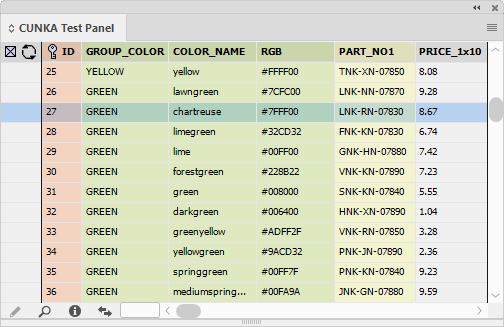
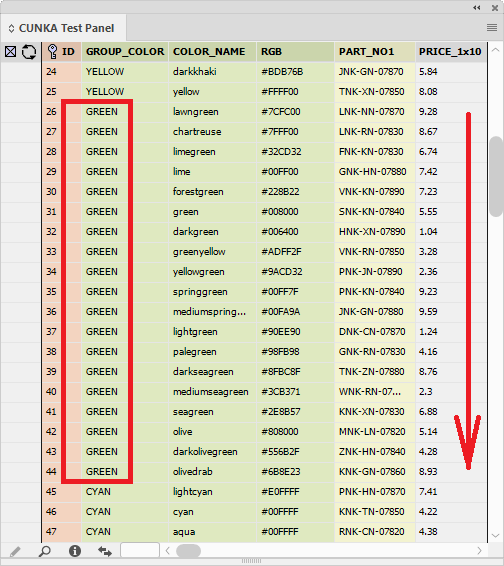
We want to filter our records down to build a table using the GROUP_COLOR field. So we can have a table of only the "GREEN" colors.
The field PRICE_1x10 will not only display the price, it will be used to sort the records from lowest to highest when filtered.
The first thing we need to do is create a new custom field called color_LUAtable.
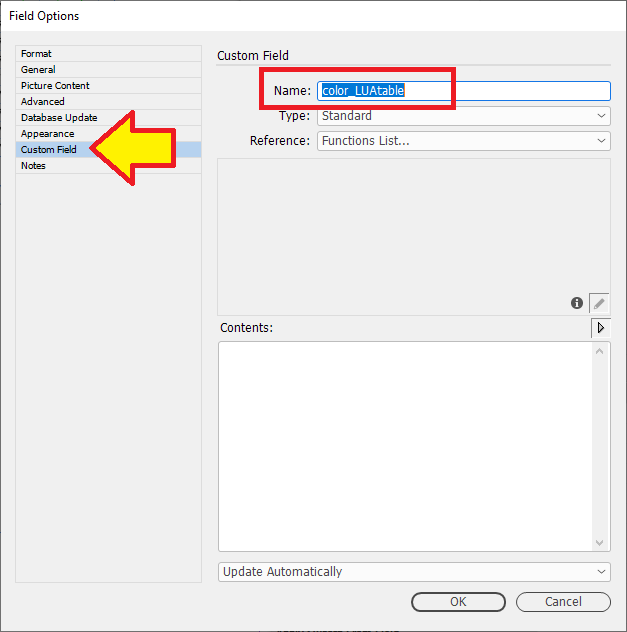
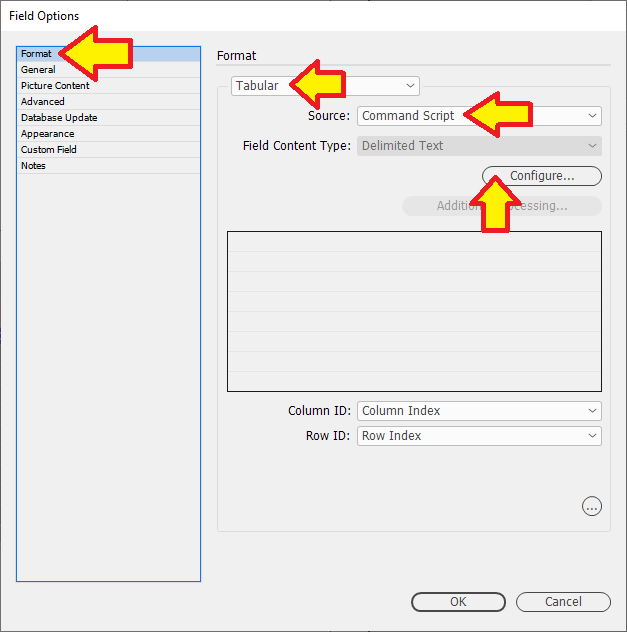
In the "Format" tab we set Tabular and the "Source:" to be Command Script.
Now press the "Configure" button.
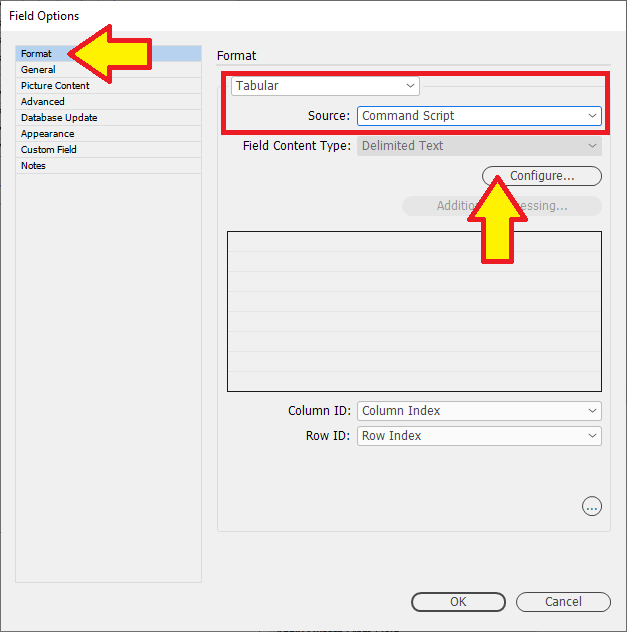
The next screen is where we enter our LUA code.
-
recordset = DATASOURCE.get():getrecordset()`
Go to the existing data source panel and get all the records and store them in recordset -
recordset:sort('PRICE_1x10')
With all the records in recordset sort them using the numbers in the field PRICE_1x10 -
filteredset = recordset:filter('GROUP_COLOR',FIELD.get('GROUP_COLOR'):content())
Using the field GROUP_COLOR check every record in recordset and see if it matches. If it does, put the record into filteredset.
Eg. If the GROUP_COLOR is GREEN, filter and keep the GREEN records all together -
result = filteredset:tableof('COLOR_NAME','RGB','PART_NO1','PRICE_1x10')
Create a table from each filteredset from the fields 'COLOR_NAME','RGB','PART_NO1','PRICE_1x10' and store it in result.
The result is now our table! -
result:setcellstylerange("Brian1", 1, 1, 1, result:rowcount());
Using the table result set the column 1 cell style to "Brian1" -
result:setcellstylerange("Brian2", 2, 2, 1, result:rowcount());
Using the table result set the column 2 cell style to "Brian2" -
result:setcellstylerange("Brian2", 3, 3, 1, result:rowcount());
Using the table result set the column 3 cell style to "Brian2" -
result:setcellstylerange("Brian2", 4, 4, 1, result:rowcount());
Using the table result set the column 4 cell style to "Brian2" -
for i = 1,result:rowcount()

	do

		content = result:cell(i,2):getcontent(); — get RGB color from column 2 cell text

		result:cell(i,2):setfill(content)   — set cell background color

end
In column 2 the RGB color value is mentioned. In order to color the column cell we need to know how rows are actually in the table which is found by result:rowcount(). Using a loop we count over each cell.
First we get the value in the table cell with result:cell(i,2):getcontent() and store that in content.
Next we change the backgound color of the cell withresult:cell(i,2):setfill(content)using the value from content. -
result:cell(1,1):setwidth('4cm');
Set the width of column 1 to 4cm -
result:cell(1,2):setwidth('3cm');
Set the width of column 2 to 3cm -
result:cell(1,3):setwidth('4cm');
Set the width of column 3 to 4cm -
result:cell(1,4):setwidth('2cm');
Set the width of column 4 to 2cm -
return result:present()
Give the final table back to be used.
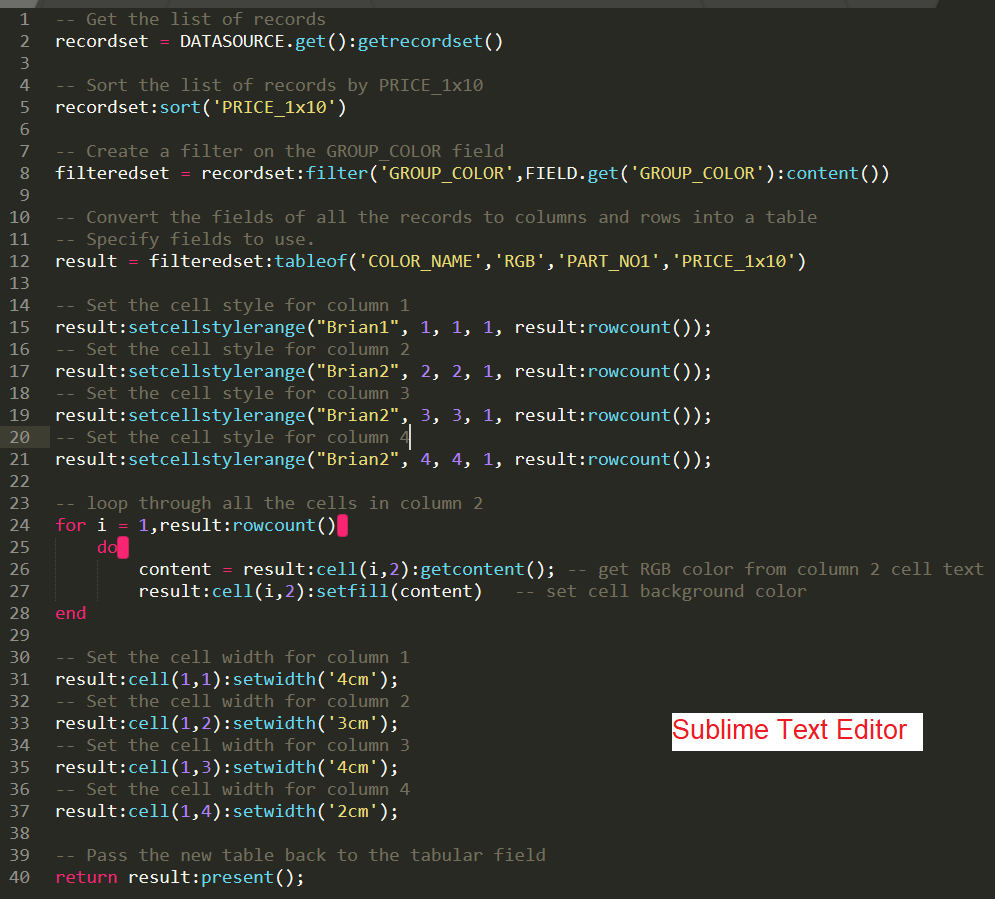
-- Get the list of records
recordset = DATASOURCE.get():getrecordset()
-- Sort the list of records by PRICE_1x10
recordset:sort('PRICE_1x10')
-- Create a filter on the GROUP_COLOR field
filteredset = recordset:filter('GROUP_COLOR',FIELD.get('GROUP_COLOR'):content())
-- Convert the fields of all the records to columns and rows into a table
-- Specify fields to use.
result = filteredset:tableof('COLOR_NAME','RGB','PART_NO1','PRICE_1x10')
-- Set the cell style for column 1
result:setcellstylerange("Brian1", 1, 1, 1, result:rowcount());
-- Set the cell style for column 2
result:setcellstylerange("Brian2", 2, 2, 1, result:rowcount());
-- Set the cell style for column 3
result:setcellstylerange("Brian2", 3, 3, 1, result:rowcount());
-- Set the cell style for column 4
result:setcellstylerange("Brian2", 4, 4, 1, result:rowcount());
-- loop through all the cells in column 2
for i = 1,result:rowcount()
do
content = result:cell(i,2):getcontent(); -- get RGB color from column 2 cell text
result:cell(i,2):setfill(content) -- set cell background color
end
-- Set the cell width for column 1
result:cell(1,1):setwidth('4cm');
-- Set the cell width for column 2
result:cell(1,2):setwidth('3cm');
-- Set the cell width for column 3
result:cell(1,3):setwidth('4cm');
-- Set the cell width for column 4
result:cell(1,4):setwidth('2cm');
-- Pass the new table back to the tabular field
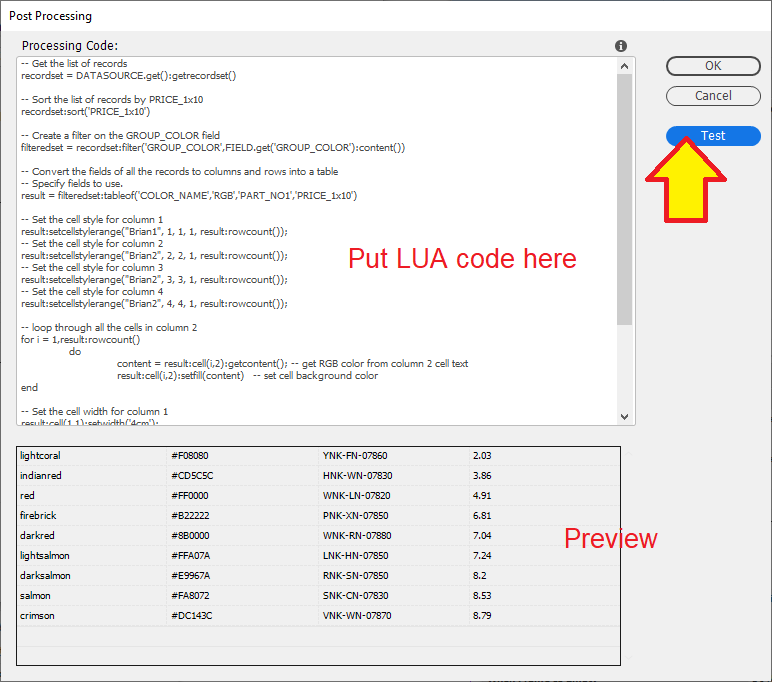
return result:present();Just for your own sanity, we do not use that tiny window to program the LUA code into EasyCatalog/InDesign.
I use Sublime Text or VSCode as my programming editors where I can edit my code. I then copy and paste that into the EasyCatalog dialog window and press "Test".
Here is the LUA code pasted in.
The "Test" button has been pressed and there is a preview of the table at the bottom.
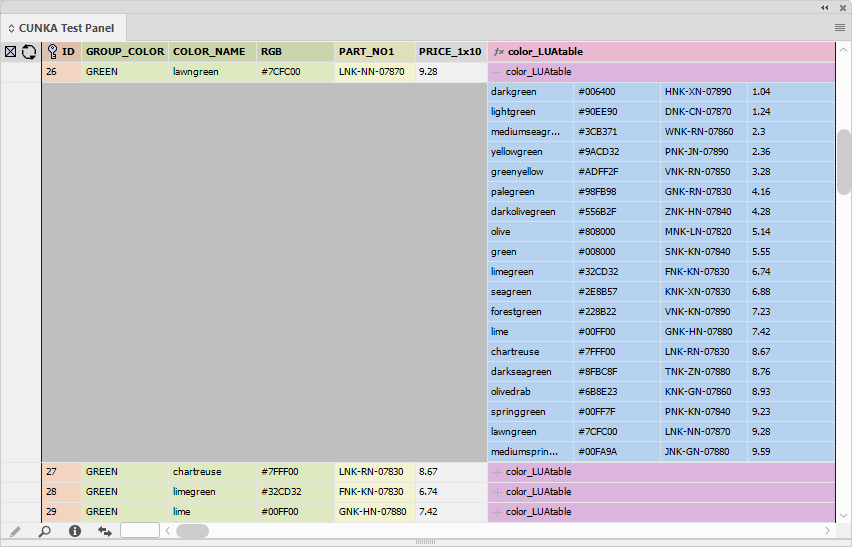
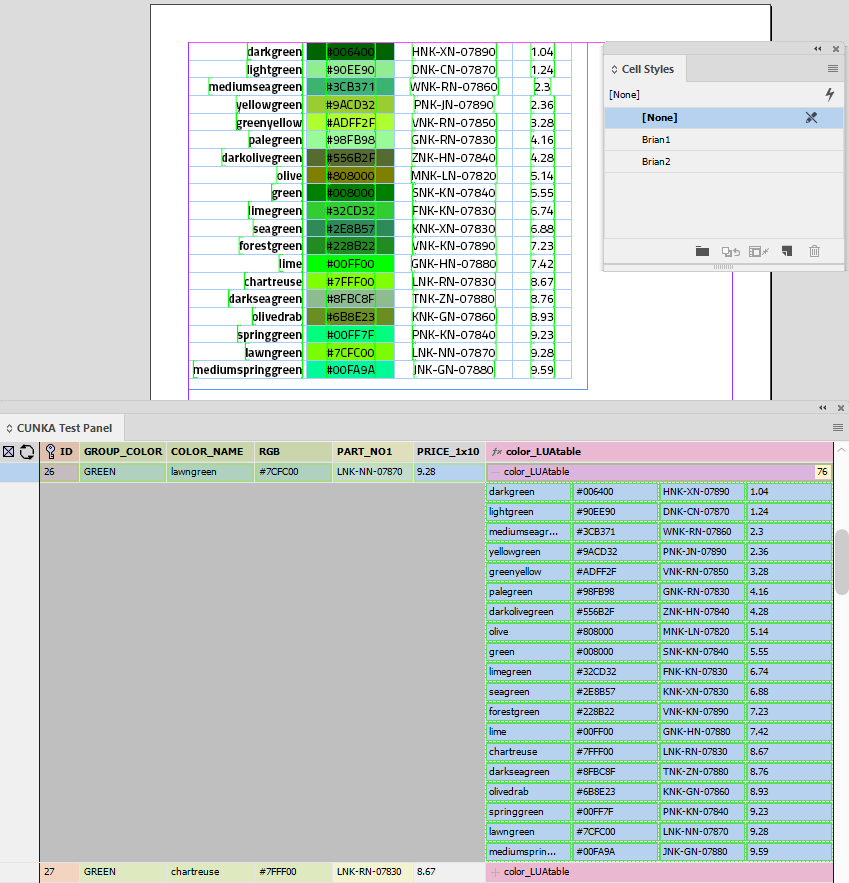
This is how the new custom field color_LUAtable looks in the data source panel. I have one of the "GREEN" records open to show the table preview.
Next we need to put a text frame on the document page, then insert a 1x1 into it.
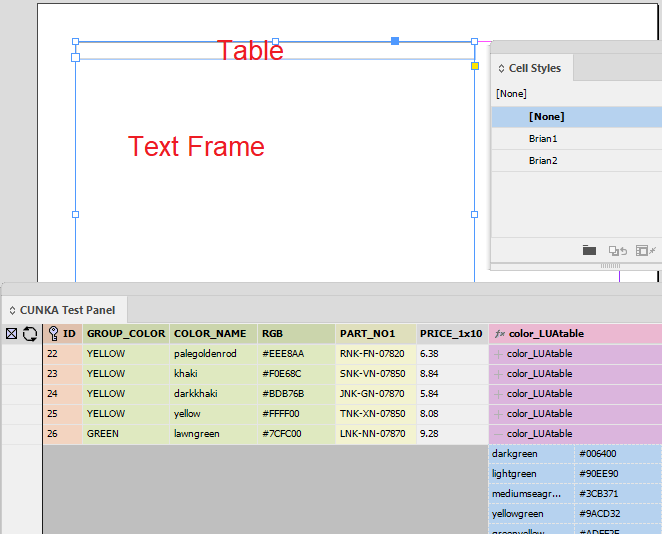
With the table selected , Table > Table Options from the EasyCatalog panel menu we apply the following settings for the table.
- Table Options settings
-
Populate Using Tabular Field
- Field
-
Tabular_HTML
- Expand
-
Vertical
- When Populating
-
Create New Table
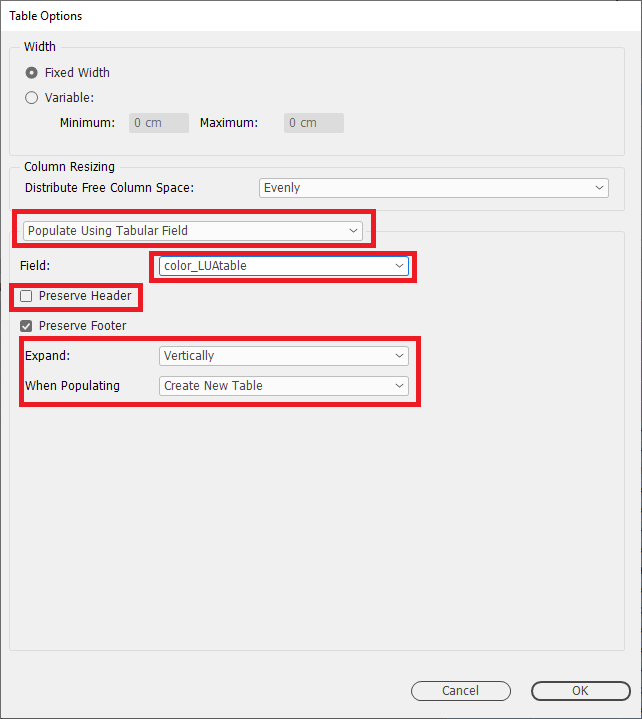
The result on the page looks like this.
HTML (formatted) Table
Prebuilt formatted HTML tables can be used in a field with EasyCatalog.
- Field Options check-box settings
-
-
Formatted
-
HTML
-
- Dropdown setting
-
-
Enhanced
-
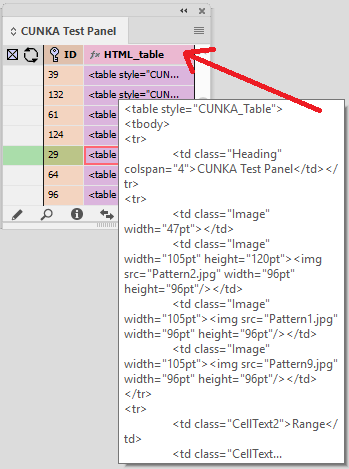
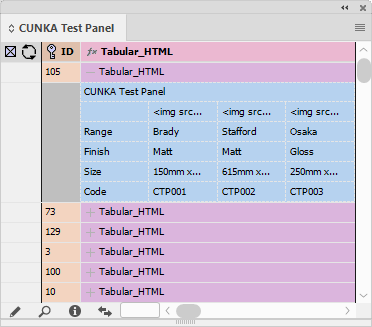
Example - Use an existing HTML Table
This example uses the following HTML table code in the field HTML_Table.
The HTML code uses styles/classes that equate to cell/table styles in InDesign.
<table style="CUNKA_Table">
<tbody>
<tr>
	<td class="Heading" colspan="4">CUNKA Test Panel</td></tr>
<tr>
	<td class="Image" width="47pt"></td>
	<td class="Image" width="105pt" height="120pt"><img src="Pattern2.jpg" width="96pt" height="96pt"/></td>
	<td class="Image" width="105pt"><img src="Pattern1.jpg" width="96pt" height="96pt"/></td>
	<td class="Image" width="105pt"><img src="Pattern9.jpg" width="96pt" height="96pt"/></td>
</tr>
<tr>
	<td class="CellText2">Range</td>
	<td class="CellText1">Brady</td>
	<td class="CellText1">Stafford</td>
	<td class="CellText1">Osaka</td>
</tr>
<tr>
	<td class="CellText2">Finish</td>
	<td class="CellText1">Matt</td>
	<td class="CellText1">Matt</td>
	<td class="CellText1">Gloss</td>
</tr>
<tr>
	<td class="CellText2">Size</td>
	<td class="CellText1">150mm x 150mm</td>
	<td class="CellText1">615mm x 615mm</td>
	<td class="CellText1">250mm x 250mm</td>
</tr>
<tr>
	<td class="CellText2">Code</td>
	<td class="CellText1">CTP001</td>
	<td class="CellText1">CTP002</td>
	<td class="CellText1">CTP003</td>
</tr>
</tbody>
</table>
Field Option settings for HTML_Table have "Formatted" & "HTML" check boxes both selected, and the dropdown box set to "Enhanced".
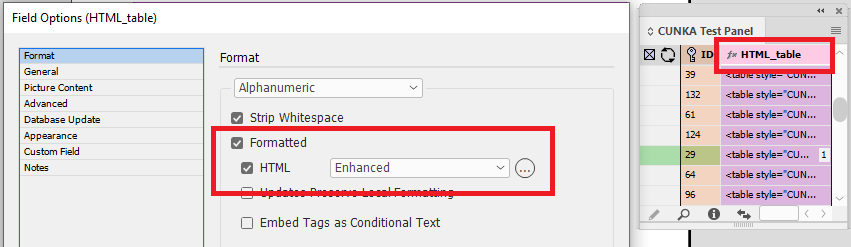
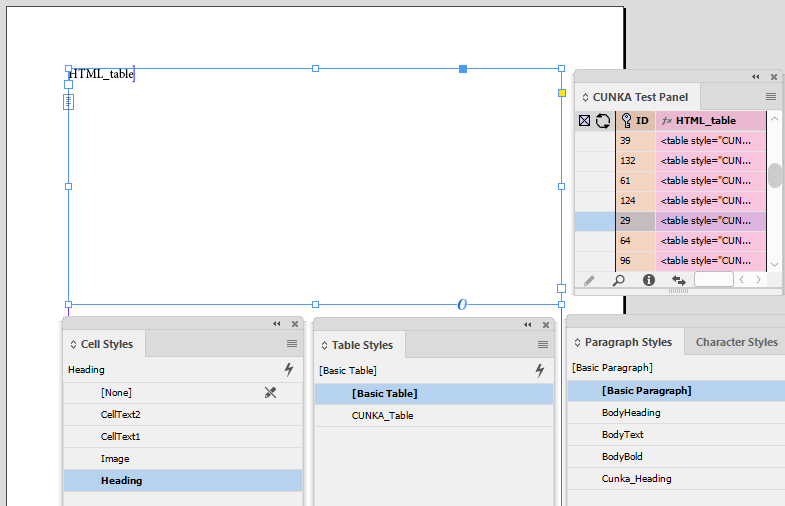
The field HTML_Table is placed into a text box.
A table has been pre-designed with the table/cell styles.
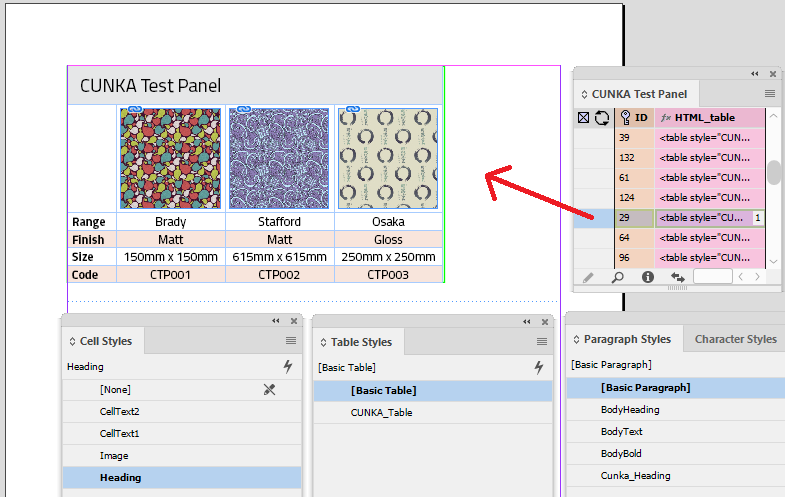
The final result shows the HTML table as a nice formatted InDesign table.
HTML (Tabular) Table
Data in the form of a HTML table can be displayed in EasyCatalog via a tabular field.
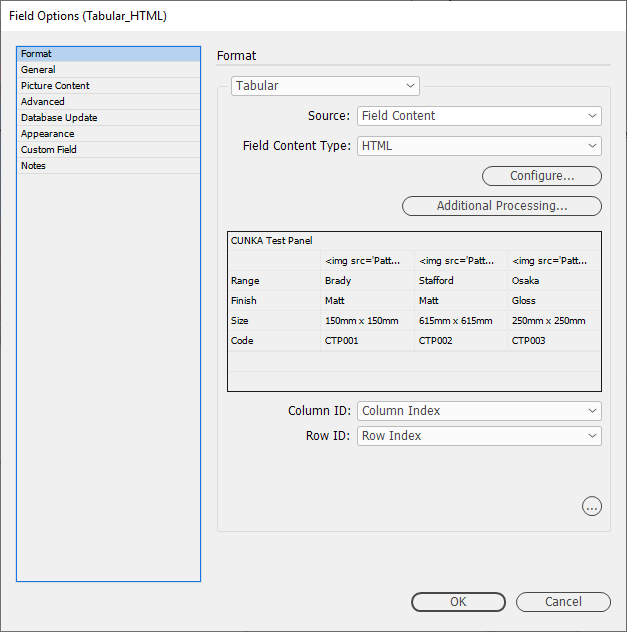
A tabular field in EasyCatalog is a special type of field that can help display tables. They can be placed into a table (recommended), or directly into a text frame.
The tabular field settings are located in the Field Options under the "Format" tab.
- Settings for a HTML tabular field
-
- Format
-
-
Tabular
-
- Source
-
-
Field Content
-
- Field Content Type
-
-
HTML
-
| Press the Configure button to preview the result. |
Additional Processing is available through LUA to manipulate the table result.
Example 1 - Tabular HTML field with InDesign Table
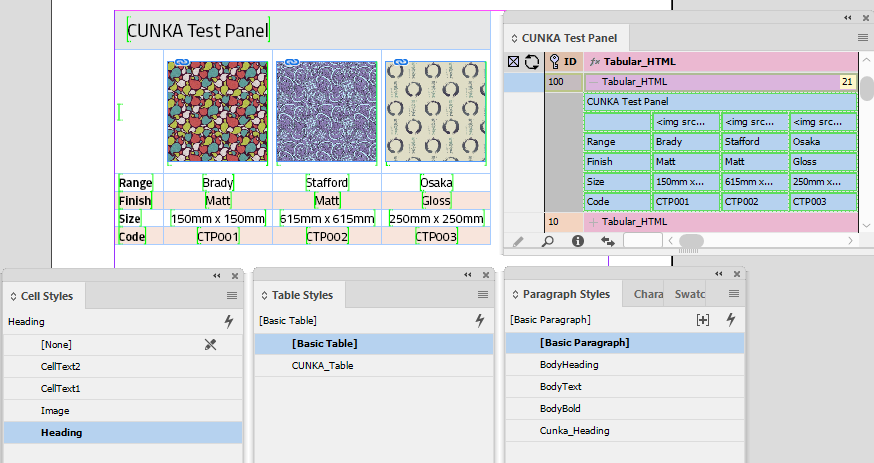
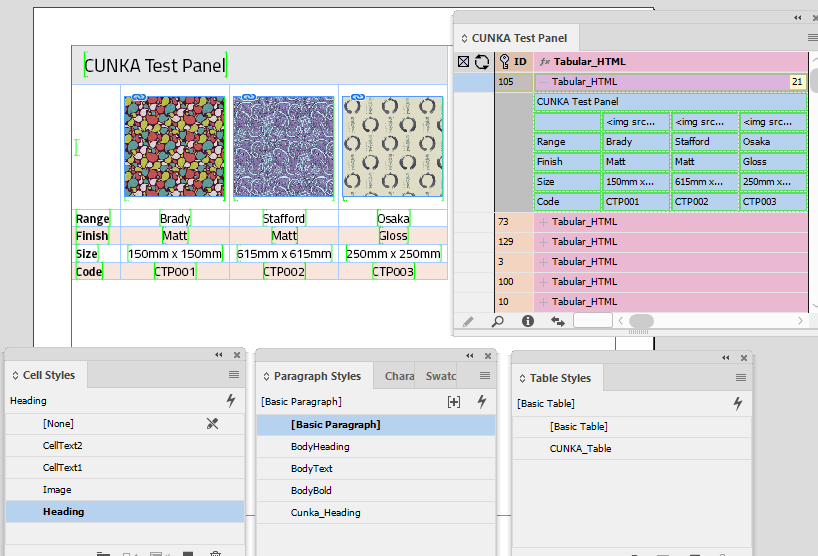
In this example a HTML tabular field called Tabular_HTML has been created. The contents of the HTML can be shown on the panel preview below.
On the document page, there is a single row, single column InDesign table.
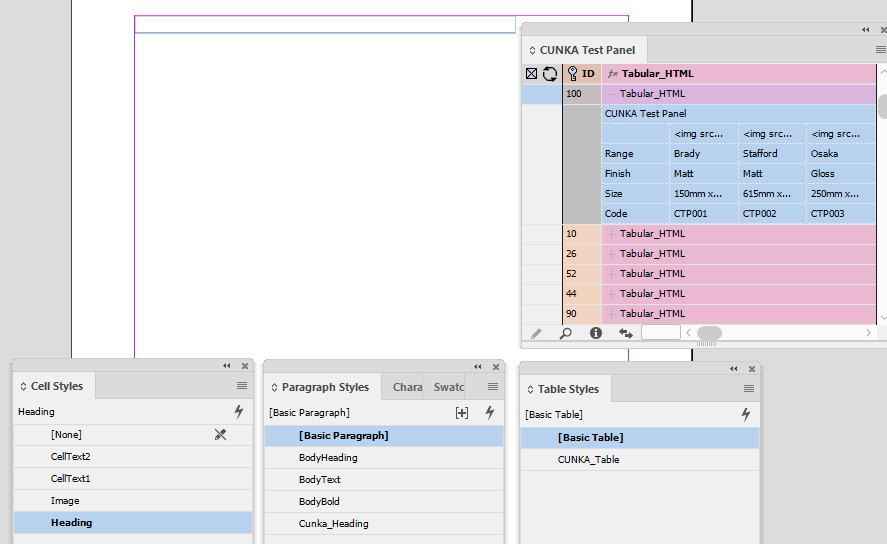
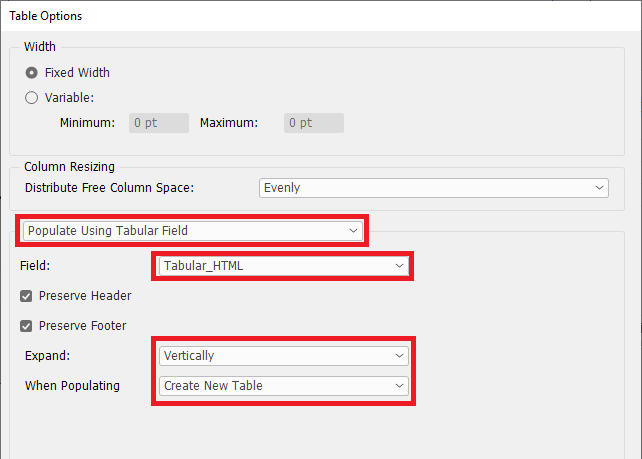
To set the table up to use the EasyCatalog tabular field, the "Table Options" need to be selected.
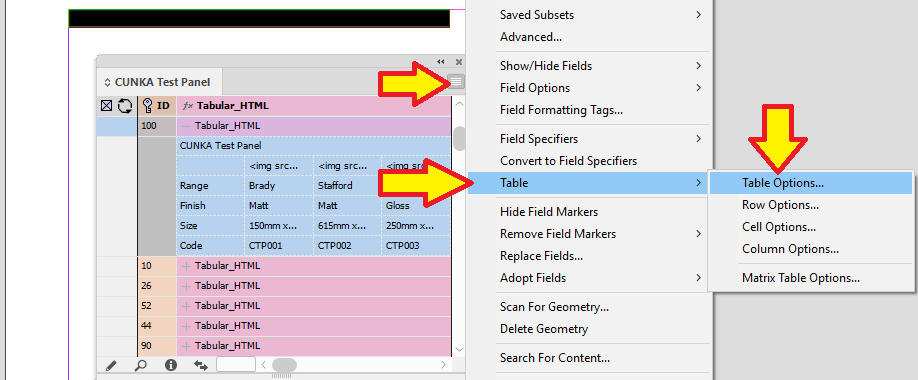
- Table Options settings
-
Populate Using Tabular Field
- Field
-
Tabular_HTML
- Expand
-
Vertical
- When Populating
-
Create New Table
Final result on the page is a nice formatted table. (Assuming you have included styles in your HTML)
Example 2 - Tabular HTML field into a text frame
This example is the same as Example 1 with the exception that an InDesign table is not used, and the tabular field is placed directly into a text frame.
The final result is the same as in Example 1.
Its recommended to see best results using the method outlined in Example 1.
CSV (Tabular) Table
CSV formatted text (commonly called Delimited Text) can be displayed in EasyCatalog via a tabular field.
Example
In this example, we will take CSV formatted text from a field into a tabular field to generate a table.
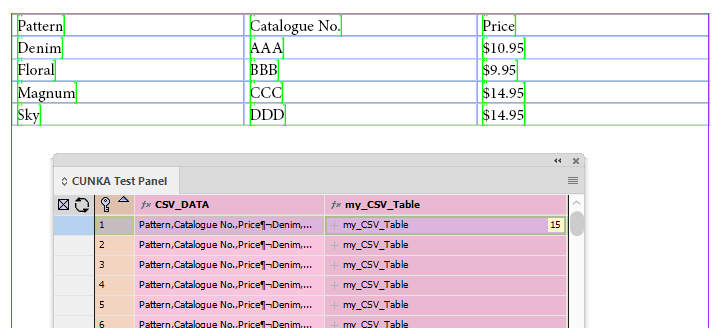
Pattern,Catalogue No.,Price
Denim,AAA,$10.95
Floral,BBB,$9.95
Magnum,CCC,$14.95
Sky,DDD,$14
The field CSV_Data contains the raw CSV formatted text.
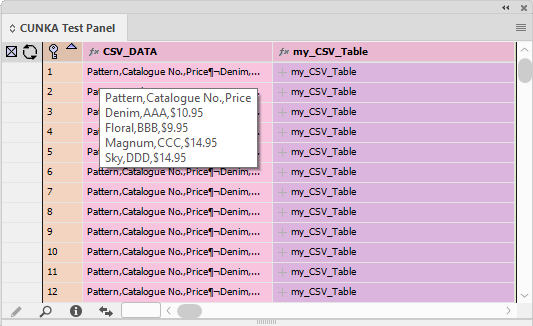
A custom field called my_CSV_Table is created to pull in the contents of the CSV_Data field through the command FIELDSTR(CSV_Data).
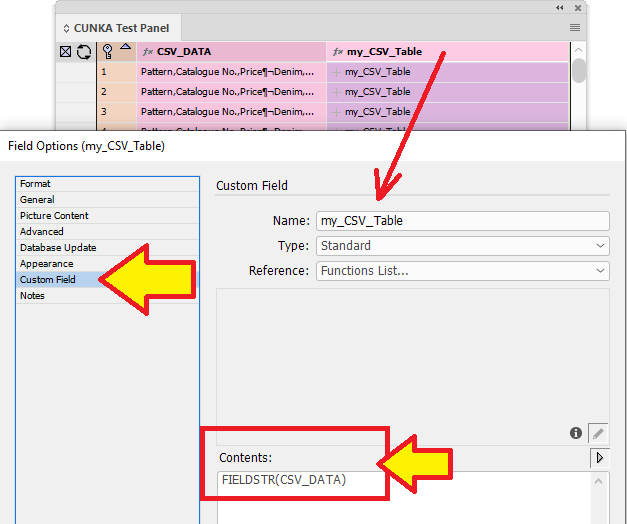
The tabular field settings are located in the Field Options under the "Format" tab.
- Settings for a CSV tabular field
-
- Format
-
-
Tabular
-
- Source
-
-
Field Content
-
- Field Content Type
-
-
Delimited Text
-
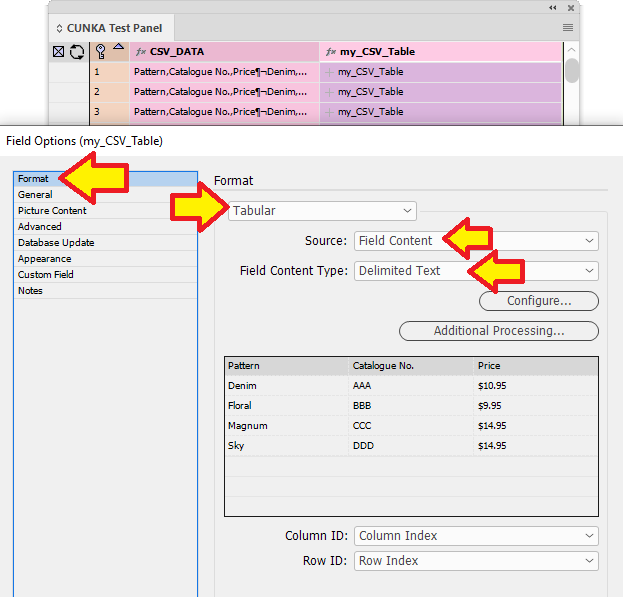
We need to help EasyCatalog out a bit and know a little bit ourselves about how the CSV text is constructed.
CSV text usually divides its infomation in columns and rows by using a comma as the column seperator, and a carriage return as a row seperator. Due to the flexibility with what you can use to seperate with, EasyCatalog will need to know what our text will be formatted in.
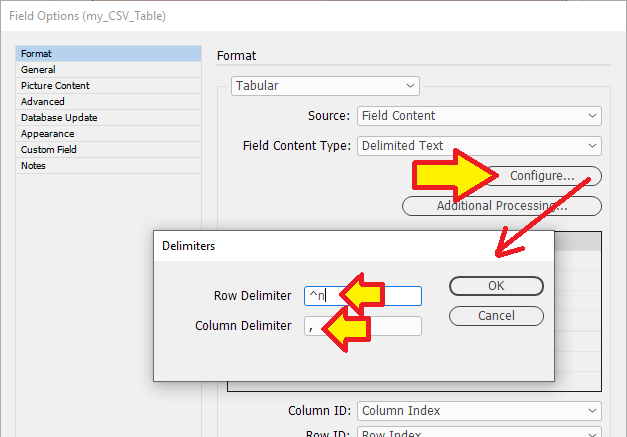
Select the "Configure" button to set up the row/column delimiters.
- Row Delimiter
-
Carriage Return (^n)
- Column Delimiter
-
Comma (,)
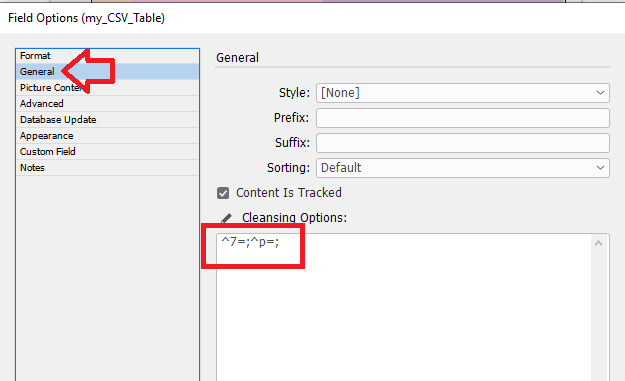
Due to the formatting of the text, there can be additional characters in our text which will mess things up. As a quick example, paragraph end markers/symbol.
To remove the paragraph end marker & paragraph symbol, we need to use the "Cleansing Options" from the EasyCatalog metacharacters list.
- Paragraph End Marker
-
Use ^p
- Paragraph Symbol
-
Use ^7
Next , set up the document.
Simply put a text frame on the page and add a new table with 1 row / 1 column.
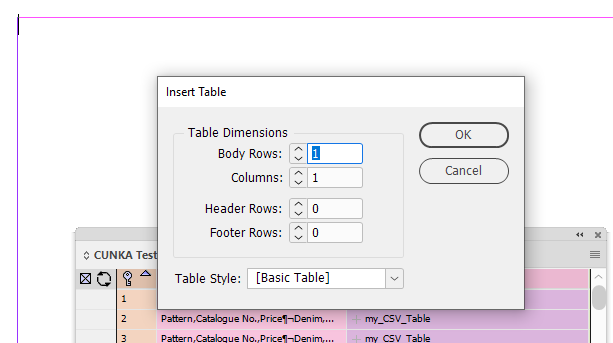
Select the table and set up the "Table Options" in EasyCatalog. The set up is as follows.
- Populate Using Tabular Field
- Field
-
my_CSV_Table
- Preserve Header
-
Checkbox is not selected.
- When Populating
-
Create New Table
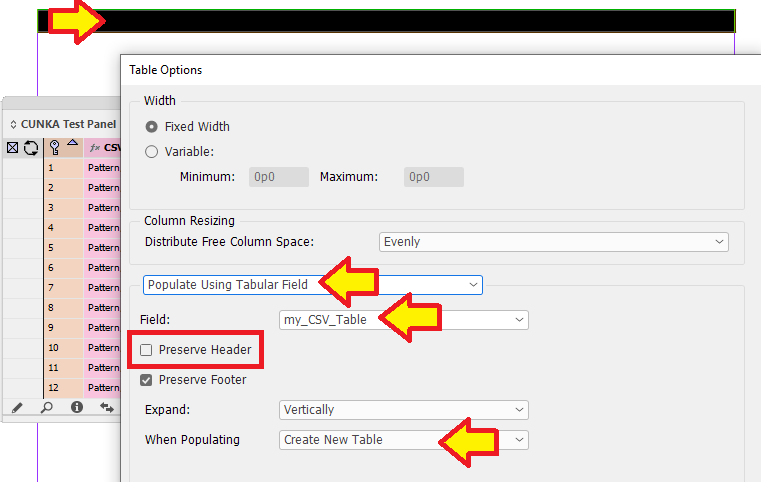
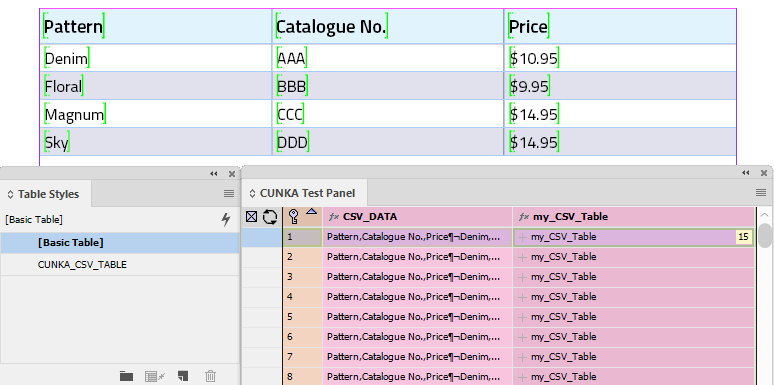
When we drag and drop a record on to the table, the CSV text now appears as table on the page.
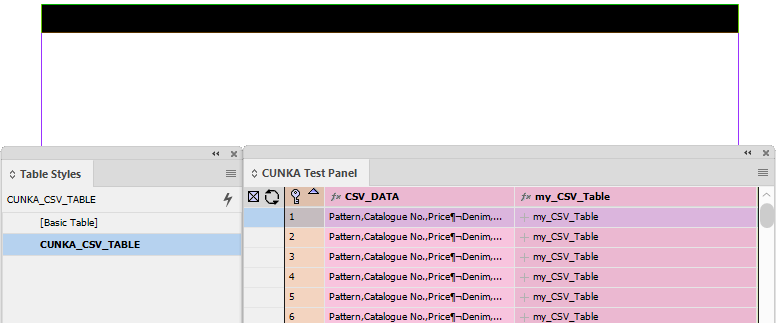
This can be improved by supplying a Table Style.
The table style CUNKA_CSV_TABLE will now be applied to the table. To do that we will do it through the field my_CSV_Table and not the table itself.
The reason being in the Table Options the set up we applied said When Populating: Create New Table. So any style applied to that table will be removed when we apply the field my_CSV_Table. To fix that, we simply get the field my_CSV_Table to apply the table style.
In the field options for my_CSV_Table under the "Format" tab, click on "Additional Processing".
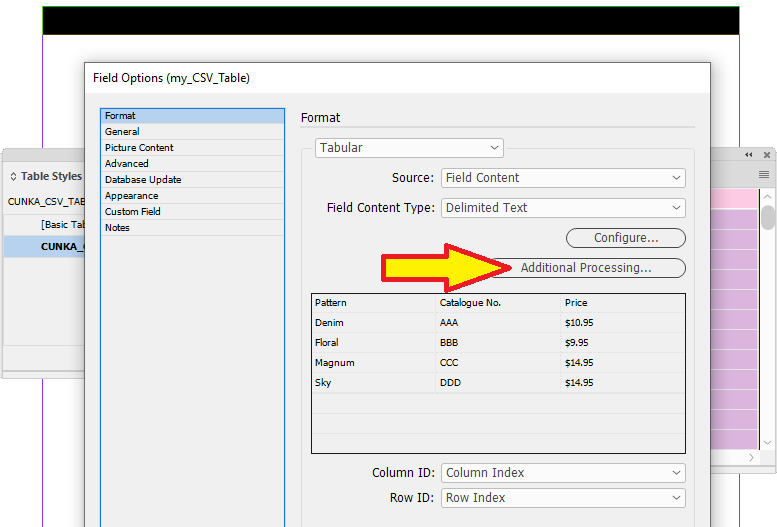
This takes you into the area where you can do additional processing of the table through the LUA programming language and preview it.
Its very simple and easy for any designer to do!
The code we will be using can simply be cut/paste into any similar tabular fields. The only thing you need to know is how many heading rows are in your table, and the name of the table style you wish to use.
Just note the color of the preview area for now.
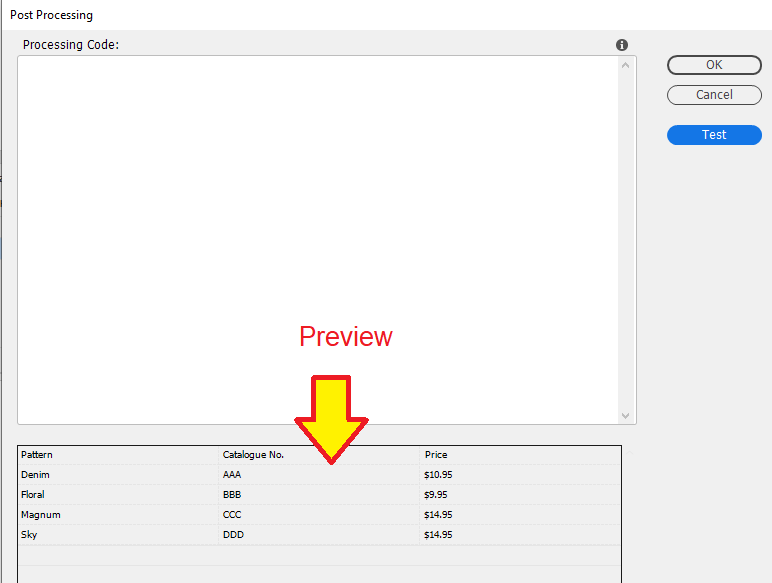
Here is the LUA code to copy/paste in.
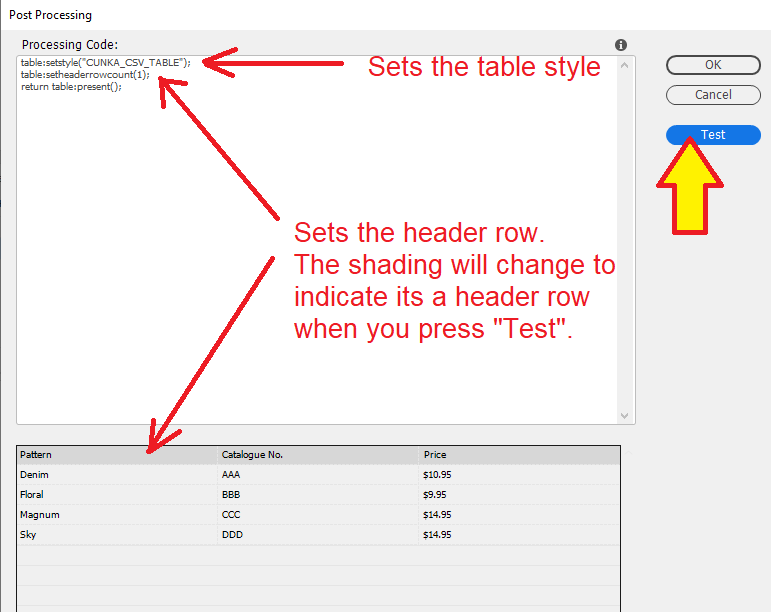
table:setstyle("CUNKA_CSV_TABLE");
table:setheaderrowcount(1);
return table:present();
- table:setstyle("CUNKA_CSV_TABLE");
-
This line simply applies a table style called CUNKA_CSV_TABLE
- table:setheaderrowcount(1);
-
This line instructs the table how many header rows we have.
- return table:present();
-
This line tells EasyCatalog to apply these settings to the table.
To test the code, click on the "Test" button.
You will notice the top row is now shaded darker. This darker shading indicates a "row heading".
Press "OK" when finished.
Now when you drag and drop a record on to the table you will see a nicely formatted table.
Data Source (Tabular) Table
Fields from any Data Source panel can be grouped and formatted into a table in EasyCatalog via a tabular field.
Example
In this example, we will take 3 fields from the existing data source panel (it could easily have been from another data source panel) and use them to create a new custom tabular field to create a table.
Our panel is made up of colors with a fake part number and price that will wrapped up into a table.
The 3 fields in the table taken from the "CUNKA Test Panel" are:
-
COLOR_NAME
-
PART_NO1
-
PRICE_1x10
The field GROUP_COLOR is used to to tell the data source tabular field how to group the table.
First thing we do is to create the new custom field. I’ve given it the name myColor_DataSource.
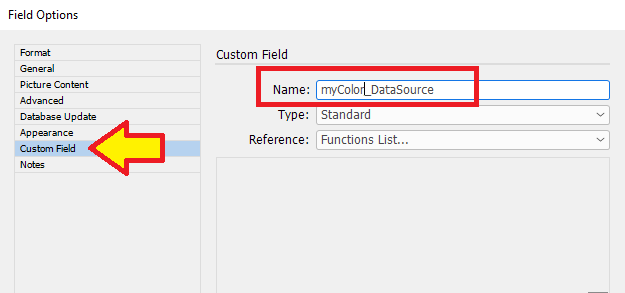
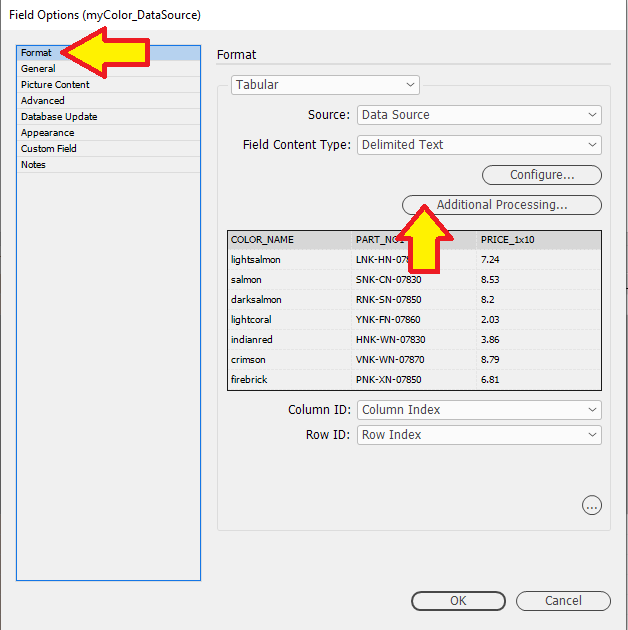
On the Format: tab of the new custom field, we set it to "Tabular" and set the "Source:" to Data Source.
We then press the "Configure" button.
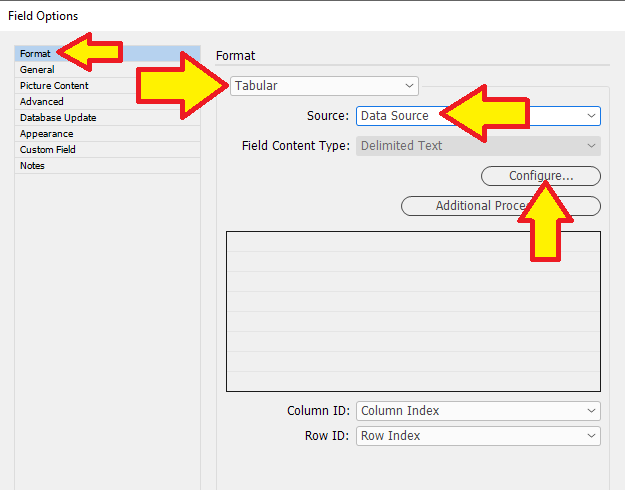
The "Table Field Configuration" dialog appears.
This screen may initially be a little confusing, so lets take a little time to explain it.
The whole use of "Tabular" > "Data Source" is very flexible. We can not only create a table from fields from within our current data source panel, but we can create a table from any other existing data source panel.
So there has to be a field that could be used as a "key" to indicate how the data will be grouped. Once you have that field, you can then say to any data source to look at a particular field of its own to try and match between the two. If there is a match, then use it as a row in the table.
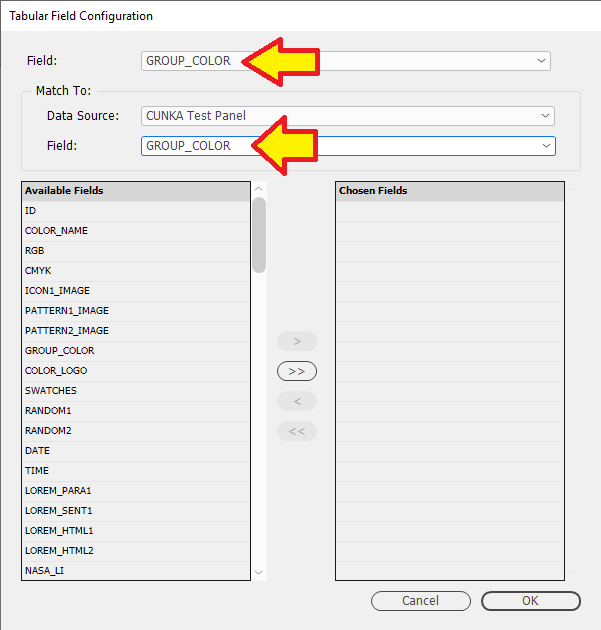
Just so happens that field GROUP_COLOR was set up to group the colors together, so I’m using that as my "key".
Field:-
This is a "key" field to generate the table. We want the values in this field.
Data Source:-
The Data Source to look in. This can be the existing data source, or another data source panel.
Field:-
The field to match to the "key". This field values must match the values in the "key" field.
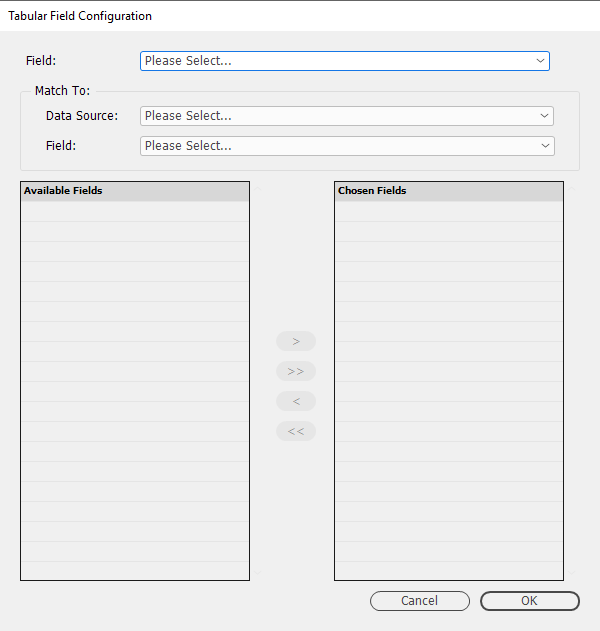
Firstly I select the Data Source panel we want to match to. This is the existing data source panel "CUNKA Test Panel".
This will give us a list of "Available Fields" to choose from.
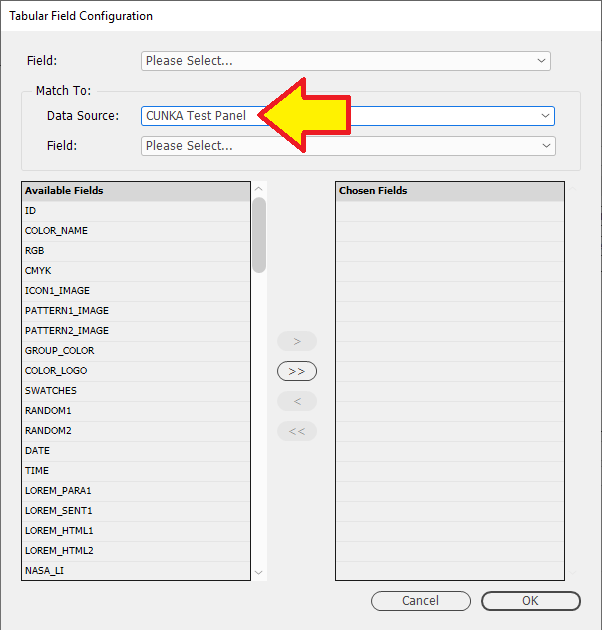
The fields I want checked and matched against are the GROUP_COLOR field.
eg.I want to group all the "RED" colors together…"BLUE" colors together.
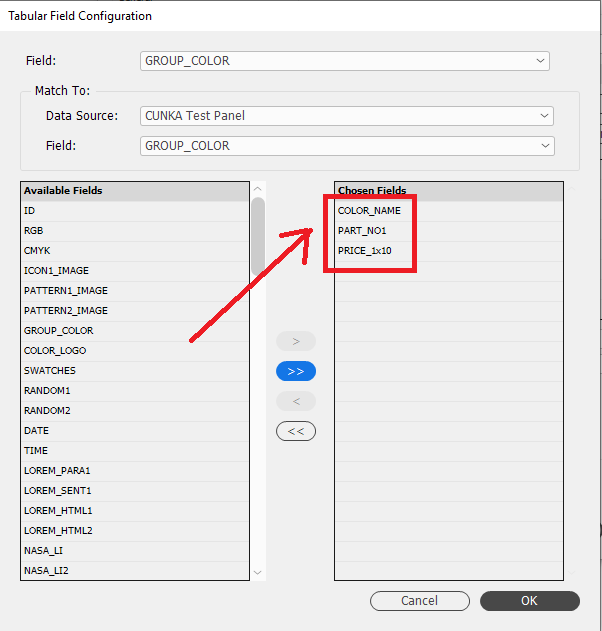
From the "Available Fields" we can now now select our "Chosen Fields".
-
COLOR_NAME
-
PART_NO1
-
PRICE_1x10
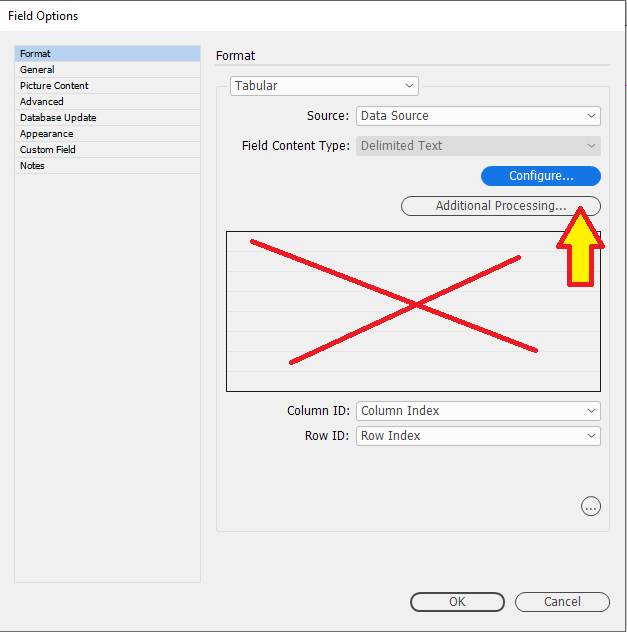
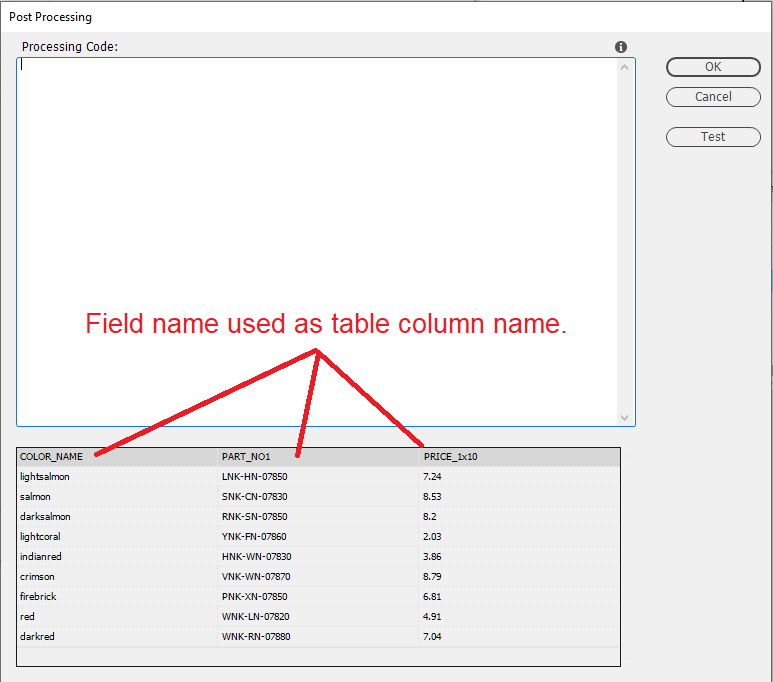
Because we are creating the custom field, there is no preview of the table. However, we can sneak a view of it by pressing the "Additional Processing…" button.
You can now see a preview of the table.
| The table column headings are the field names that were selected. |
Press "OK" when finished.
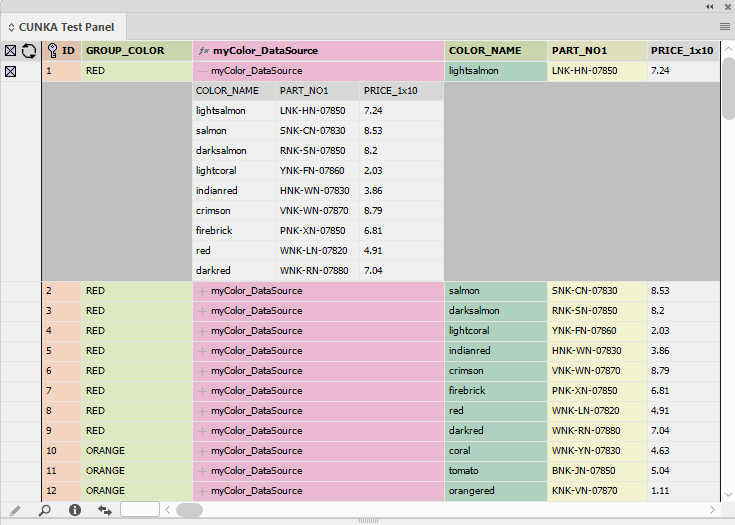
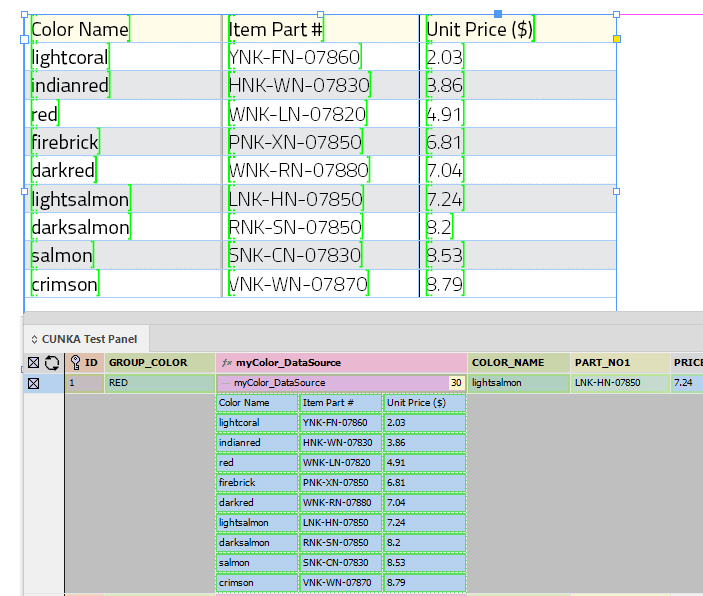
This is the new custom field myColor_DataSource in the "CUNKA Test Panel".
A text frame is created on the document page, and a 1x1 table is inserted into it.
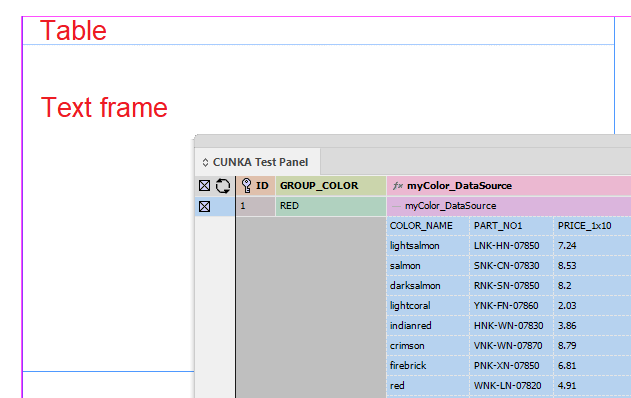
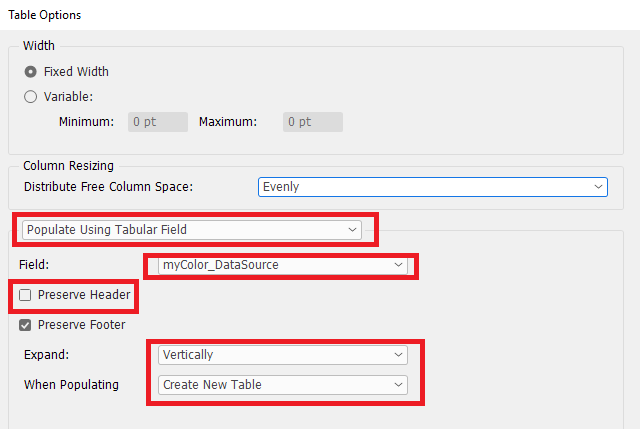
With the table selected we edit the table options and use the following settings
- Populate Using Tabular Field
- Field
-
myColor_DataSource
- Preserve Header
-
Checkbox is not selected.
- Expand
-
Vertically
- When Populating
-
Create New Table
When we drag a row to the table from the data source panel we get the following table of all the colors from the GROUP_COLOR field matching "RED".
That pretty much is all there is to creating a datasource tabular table.
However, we can think about improving how it appears and changing a few things.
Go back into the field options of myColor_DataSource and press the "Additional Processing…" button. This will allow us to change a few things relating to the generated table.
We can look at sorting the columns of the table. To do that we can use some LUA code.
All the code is pretty simple to use and can be reused in your tables. The only requirement is to understand the values been used so you can change them to your own needs.
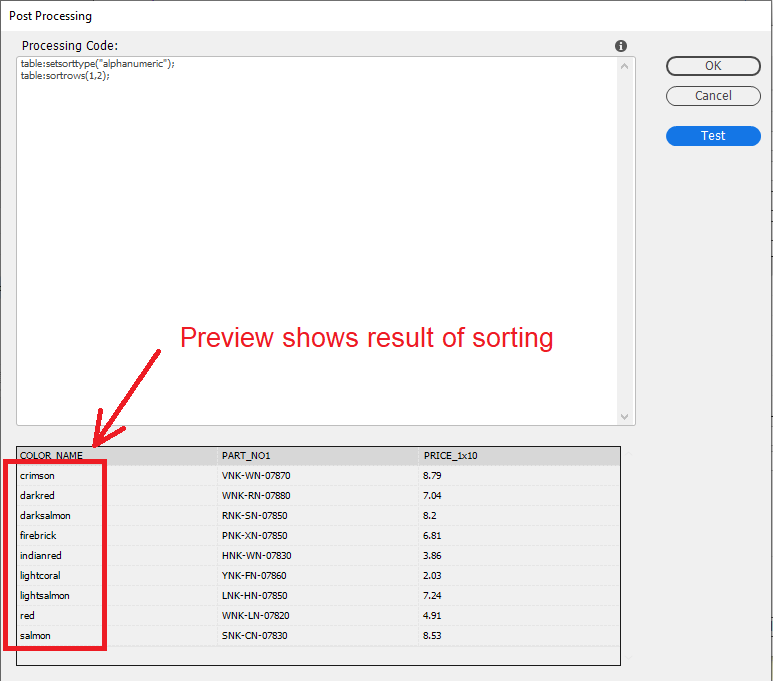
Lets first sort the 1st column into a alphanumeric order.
Here is the LUA code to copy/paste in.
table:setsorttype('alphanumeric');
table:sortrows(1,2);
This LUA code simply tells the table an "alphanumeric" sort will be applied. Start at column 1 row 2.
Why row 2?
The first row contains the column headings. Which you can see in the preview as a darker shade of grey.
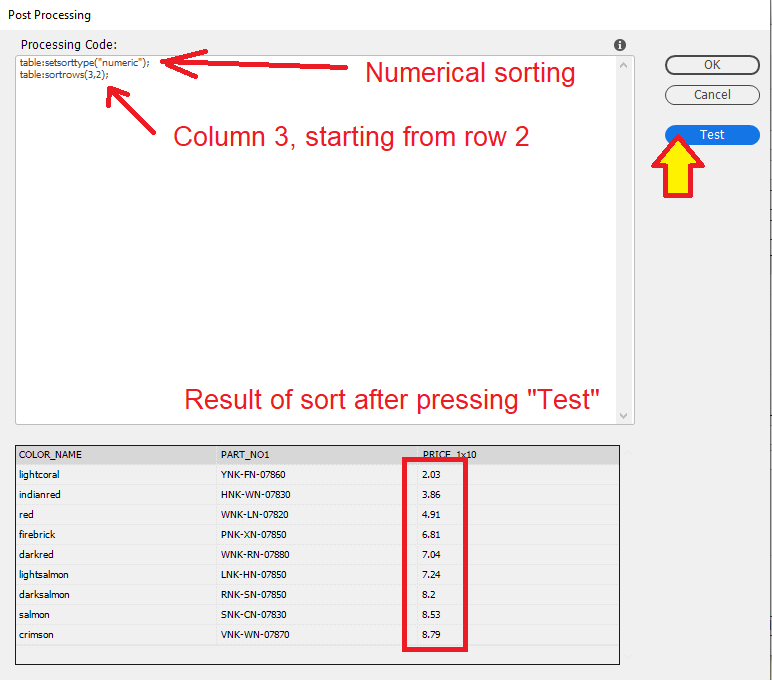
To see the results of the code press the "Test" button.
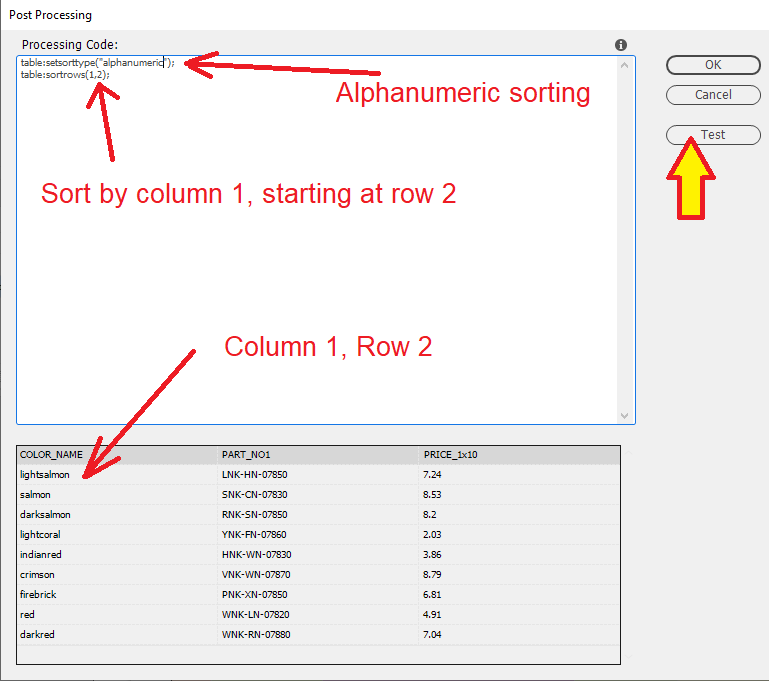
The preview now shows the result of pressing the "Test" button.
We can also apply a "numerical" sort.
This LUA code tells the table a "numeric" sort will be applied. Start at column 3 row 2.
Here is the LUA code to copy/paste in.
table:setsorttype('numeric');
table:sortrows(3,2);
Press the "Test" button to see the result.
We can also apply a table style.
I have already created a table style called CunkaStyleTable_Datasource to apply.
To simply change the table style I use the code:
table:setstyle('CunkaStyleTable_Datasource');`
Here is the LUA code to copy/paste in.
table:setsorttype('numeric');
table:sortrows(3,2);
table:setstyle('CunkaStyleTable_Datasource');
Unfortunately, you cant preview the table style. You will need to test the result on the table in the document page.
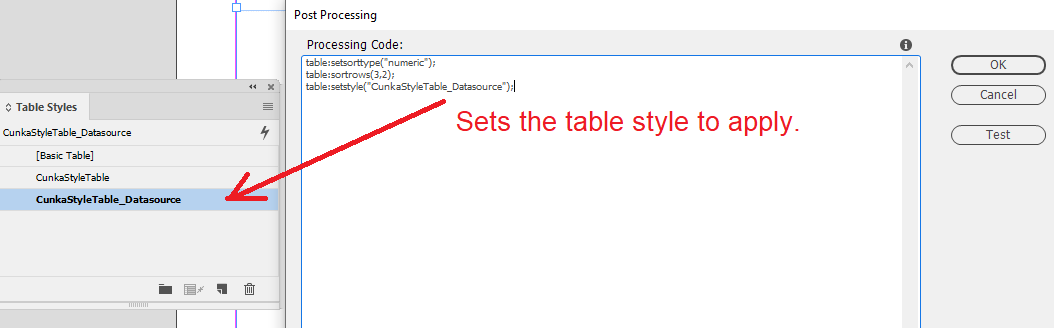
The result is a nicer looking table.
However, I still have those field names as headings in the table. They dont look appealing at all and go against a design ethic of making it easy to read.
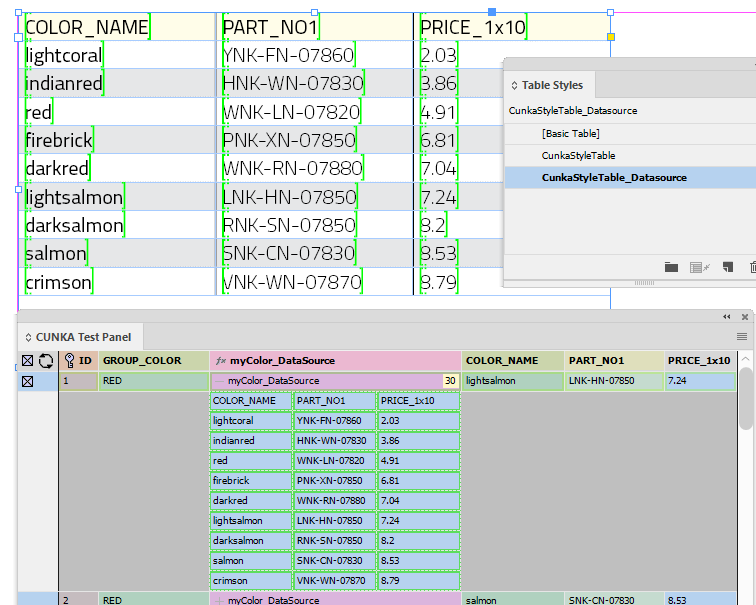
If go back in and do some "Additional Processing…" we can look at changing those headings with some more simple code.
We only need to know the row and column, and we can change the contents (in the table cell).
eg. changing the first column heading is simply table:cell(1,1):setcontent('Color Name');
Here is the LUA code to copy/paste in.
table:setsorttype('numeric');
table:sortrows(3,2);
table:cell(1,1):setcontent('Color Name');
table:cell(1,2):setcontent('Item Part #');
table:cell(1,3):setcontent('Unit Price ($)');
table:setstyle('CunkaStyleTable_Datasource');
Press the "Test" button to see the column headings change in the preview.
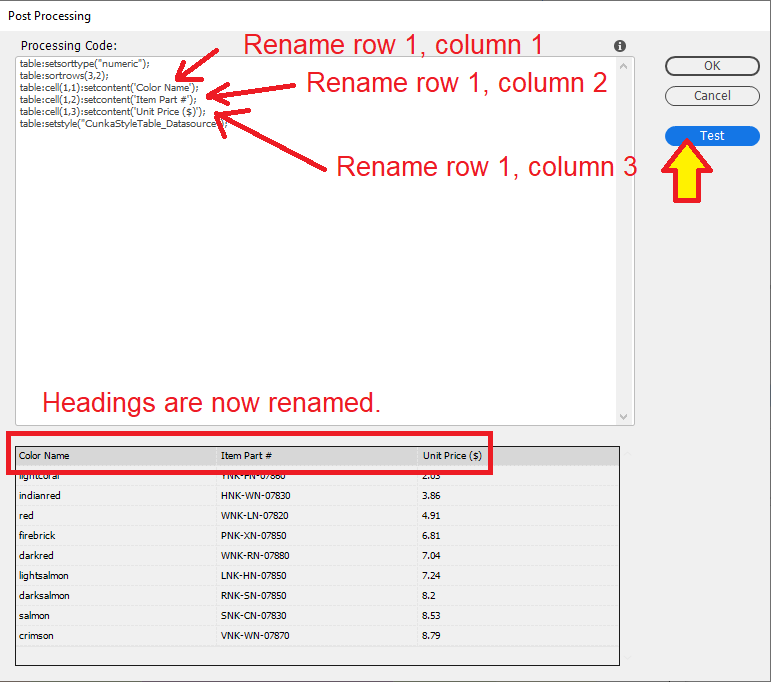
The final result of that table on the page.
It is now sorted, has a better appearance and more readable column headings.
Microsoft EXCEL (Tabular) Table
Software like Microsoft EXCEL is a powerful tool used across the business world. One of its handy features is its ability to easily build tables. There may be occasions where you made to use a table(s) directly from the EXCEL spreadsheet.
EasyCatalog allows you to directly import the table with some very simple LUA code.
Example
In this example, we will take this EXCEL spreadsheet, and create a table from it.
| A PC is used in this example, and a WINDOWS file path is shown. |
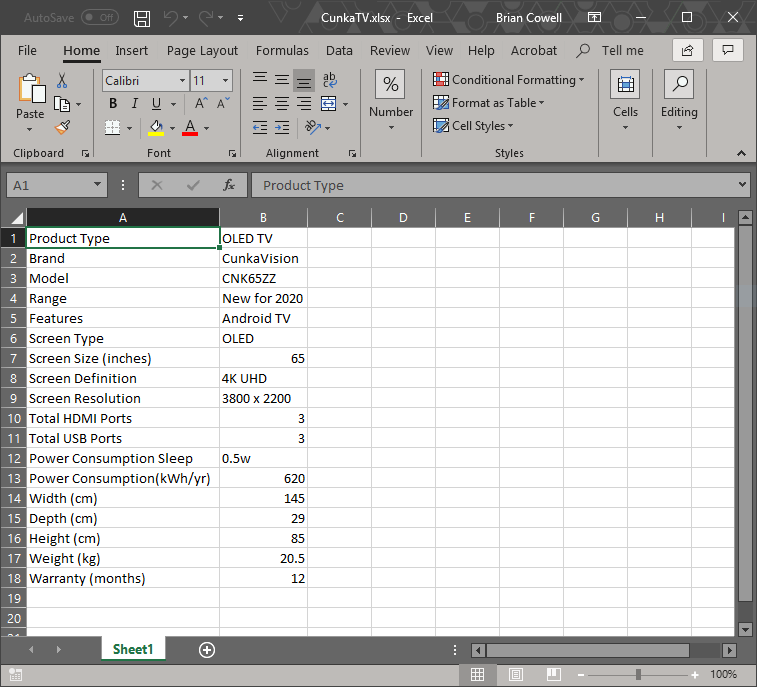
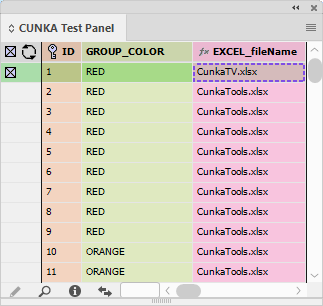
We may need to use many EXCEL spreadsheets, so we have a field called EXCEL_filename that simply contains the name of the EXCEL spreadsheet.
A new custom field is created called Excel_TV.
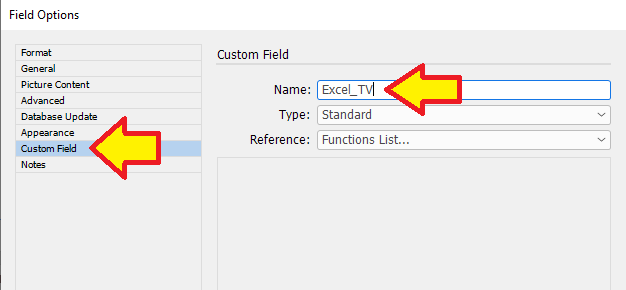
On the Format: tab of the new custom field, we set it to "Tabular" and the "Source" to Command Script. We next press the "Configure" button.
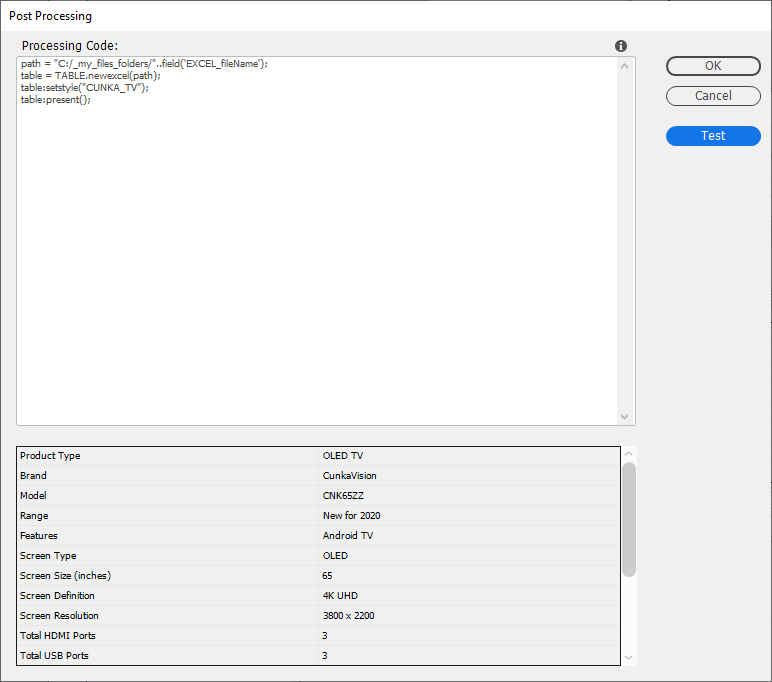
We simply paste this LUA code in and press the "Test" button to preview the result.
path = "C:/_my_files_folders/"..field('EXCEL_filename');
table = TABLE.newexcel(path);
table:setstyle('CUNKA_TV');
table:present();
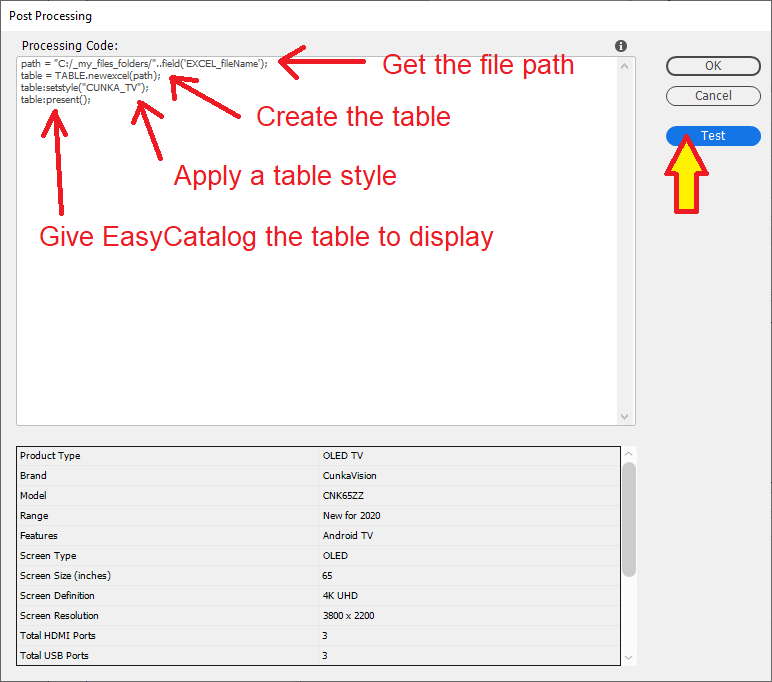
Lets take a closer look at the code and break it down into simple small steps.
This line of code gathers where the EXCEL file is located on my PC. It grabs the file path as well as the file name. Just so happens the filename is in a field called EXCEL_filename.
path = "C:/_my_files_folders/"..field('EXCEL_filename');
The next line is where the EXCEL table is created from the filepath/filename.
table = TABLE.newexcel(path);
This line simply applies a pre-designed InDesign table style to the new table.
table:setstyle('CUNKA_TV');
The last line says the table has been fully built and is ready to be presented on the page.
table:present();
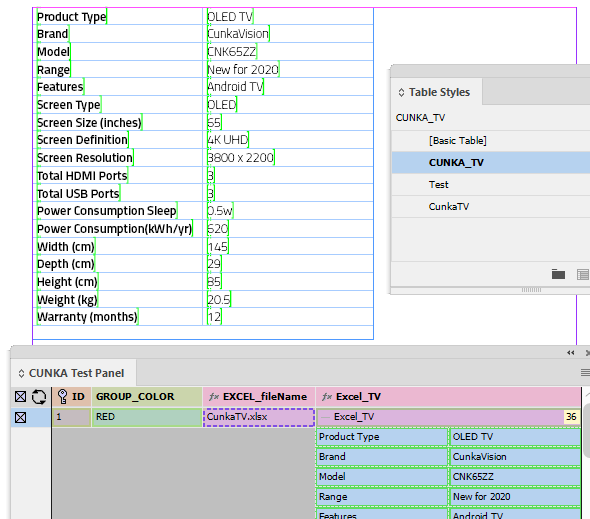
This is the new custom field Excel_TV in the "CUNKA Test Panel".
A text frame is created on the document page, and a 1x1 table is inserted into it.
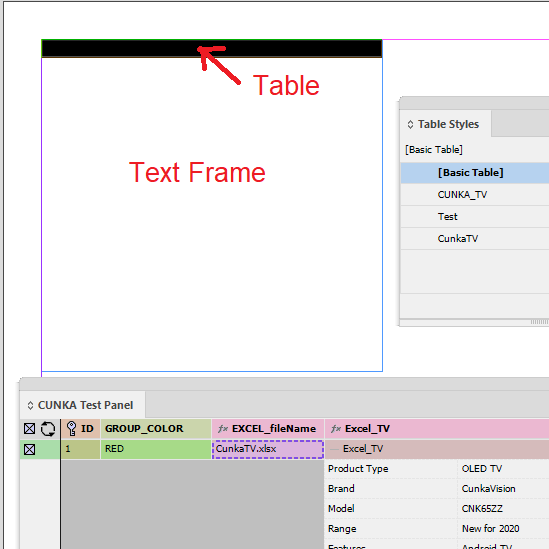
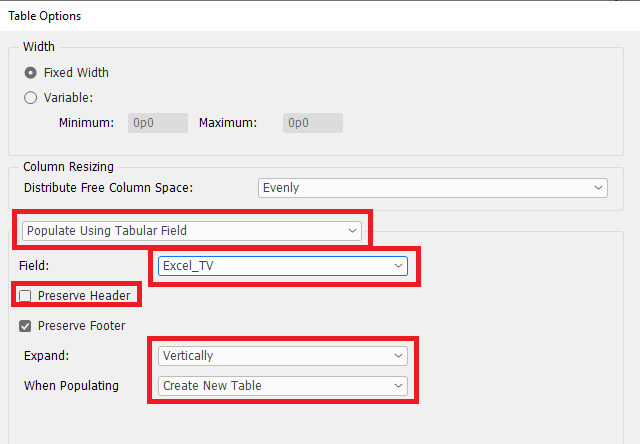
With the table selected we edit the table options and use the following settings.
- Populate Using Tabular Field
- Field
-
Excel_TV
- Preserve Header
-
Checkbox is not selected.
- Expand
-
Vertically
- When Populating
-
Create New Table
The final result showing the EXCEL spreadsheet has been imported and table has been created from it.
XML tabular field
A field containing a XML snippet can be formatted into a HTML table in EasyCatalog via a tabular field.
Example
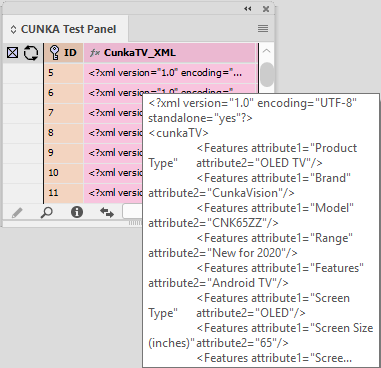
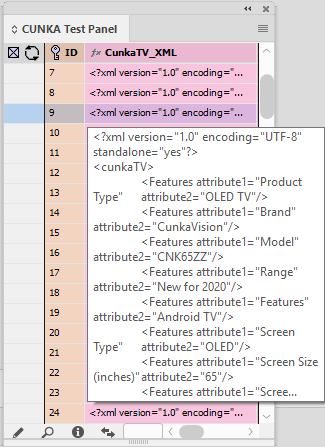
In this example, the XML snippet is loaded into the field CunkaTV_XML.
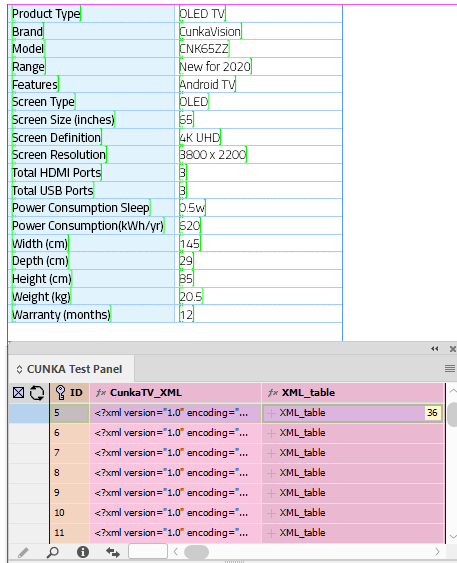
Our XML snippet is an example of a product that has a root “cunkaTV” field containing detailed technical specifications about the product.
<?xml version="1.0" encoding="UTF-8" standalone="yes"?>
<cunkaTV>
            <Features attribute1="Product Type" attribute2="OLED TV"/>
            <Features attribute1="Brand" attribute2="CunkaVision"/>
            <Features attribute1="Model" attribute2="CNK65ZZ"/>
            <Features attribute1="Range" attribute2="New for 2020"/>
            <Features attribute1="Features"         attribute2="Android TV"/>
            <Features attribute1="Screen Type"   attribute2="OLED"/>
            <Features attribute1="Screen Size (inches)"  attribute2="65"/>
            <Features attribute1="Screen Definition"      attribute2="4K UHD"/>
            <Features attribute1="Screen Resolution"      attribute2="3800 x 2200"/>
            <Features attribute1="Total HDMI Ports"     attribute2="3"/>
            <Features attribute1="Total USB Ports"         attribute2="3"/>
            <Features attribute1="Power Consumption Sleep"    attribute2="0.5w"/>
            <Features attribute1="Power Consumption(kWh/yr)"          attribute2="620"/>
            <Features attribute1="Width (cm)"    attribute2="145"/>
            <Features attribute1="Depth (cm)"    attribute2="29"/>
            <Features attribute1="Height (cm)"   attribute2="85"/>
            <Features attribute1="Weight (kg)"   attribute2="20.5"/>
            <Features attribute1="Warranty (months)"   attribute2="12"/>
</cunkaTV>
The XML is built up of a root element called cunkaTV that contains the technical Features elements. Each Features element has an attribute1 and attribute2 fields. Where attribute1 contains the name of the feature, and attribute2 contains the feature value.
The first step is to create a new custom field to be our tabular field.
I’ve named the new custom field XML_table.
In the Contents: window we import the contents of the field CunkaTV_XML.
FIELDSTR(CunkaTV_XML)
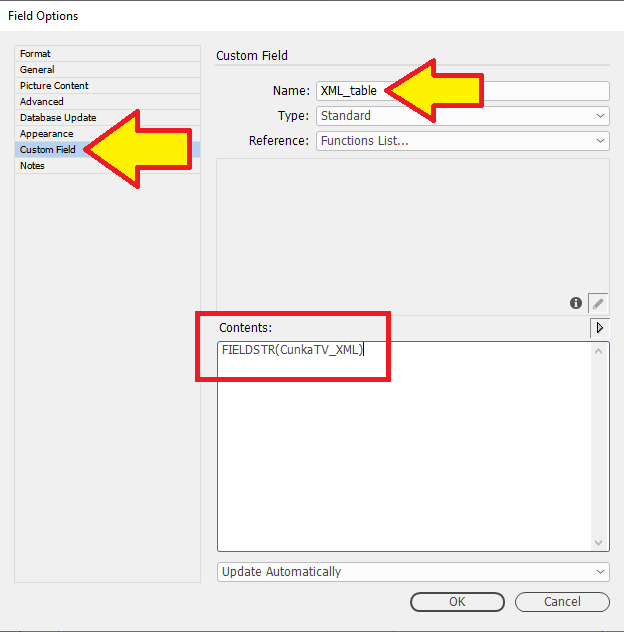
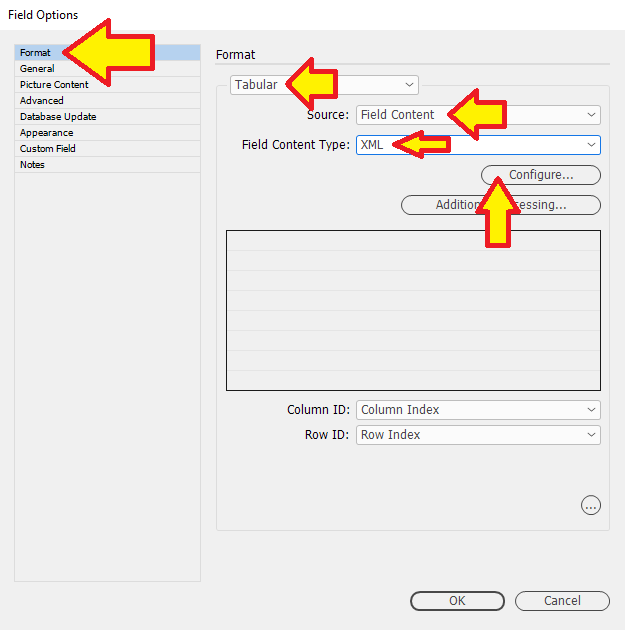
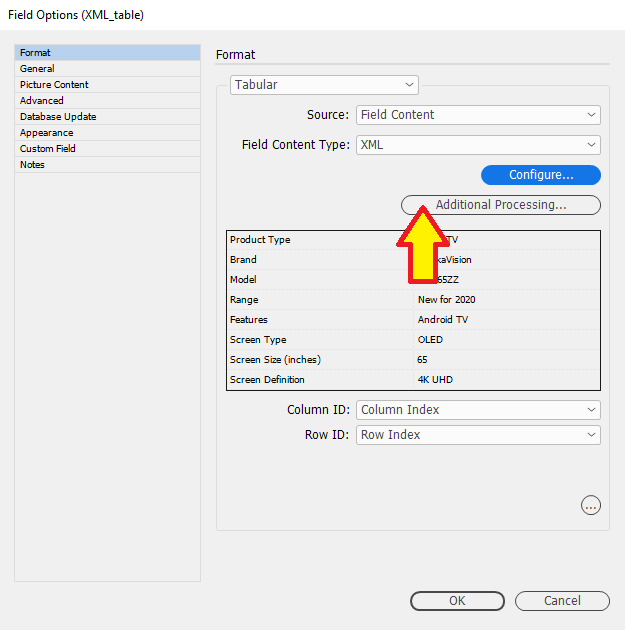
On the Format: tab of the new custom field, we set it to "Tabular" and the "Source" to Field Content. Set the "Field Content Type:" to XML.
Press the "Configure" button.
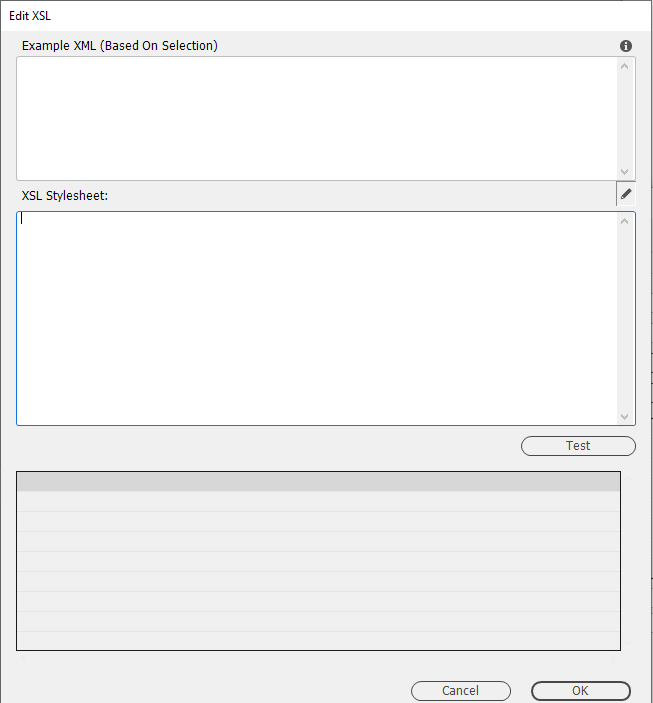
The Edit XSL dialog window appears.
This is where the XML is transformed into a HTML table.
At this point, you will now just have to press OK, and create the custom field. The reason being you cant really get a good preview of the data at this stage.
When you have created the field, come back to this stage and you will see the screen shot with a preview of the XML data.
Here is a preview of the XML data.
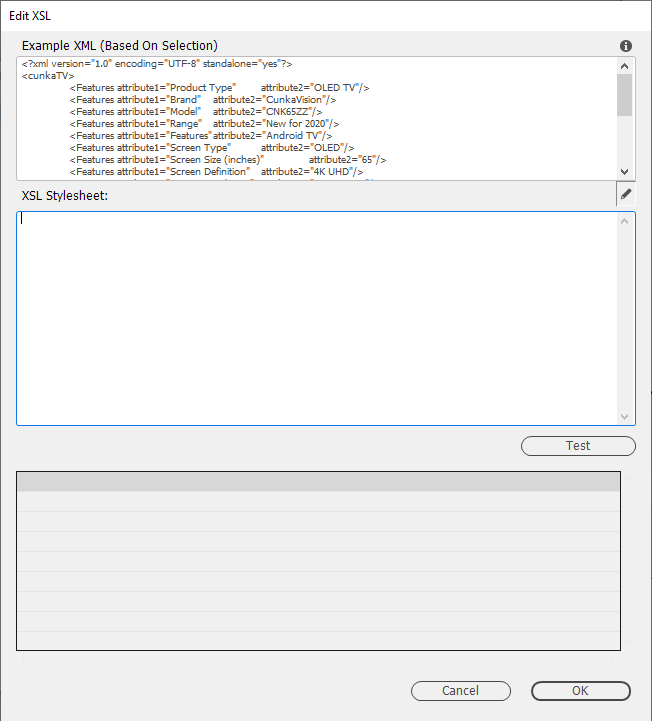
This is the source XSL transformation to paste into the XSL Stylesheet:.
<xsl:stylesheet version="1.0" xmlns:xsl="http://www.w3.org/1999/XSL/Transform">
<xsl:template match="/">
<table>
  <xsl:for-each select="/cunkaTV/Features">
    <tr>
       <td><xsl:value-of select="@attribute1" /></td>
       <td><xsl:value-of select="@attribute2" /></td>
    </tr>
  </xsl:for-each>
</table>
</xsl:template>
</xsl:stylesheet>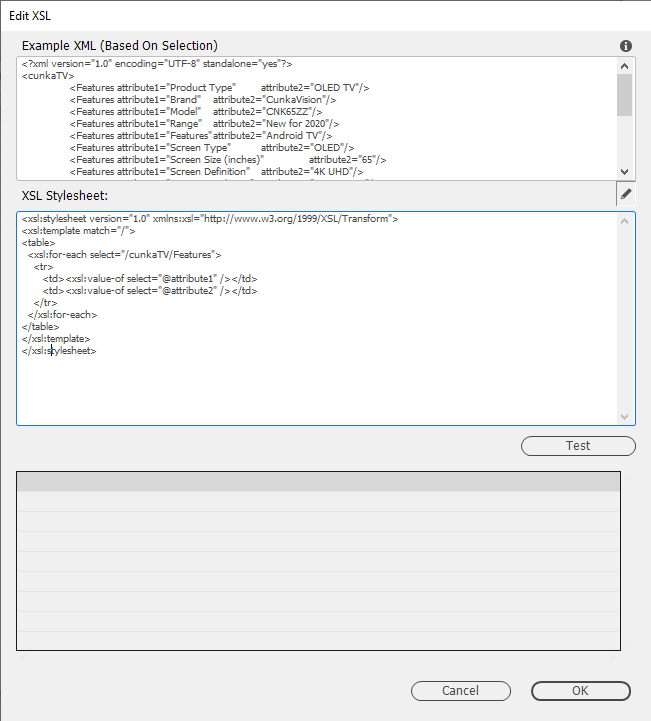
Press the "Test" button to see a table preview.
Press "OK" when finished.
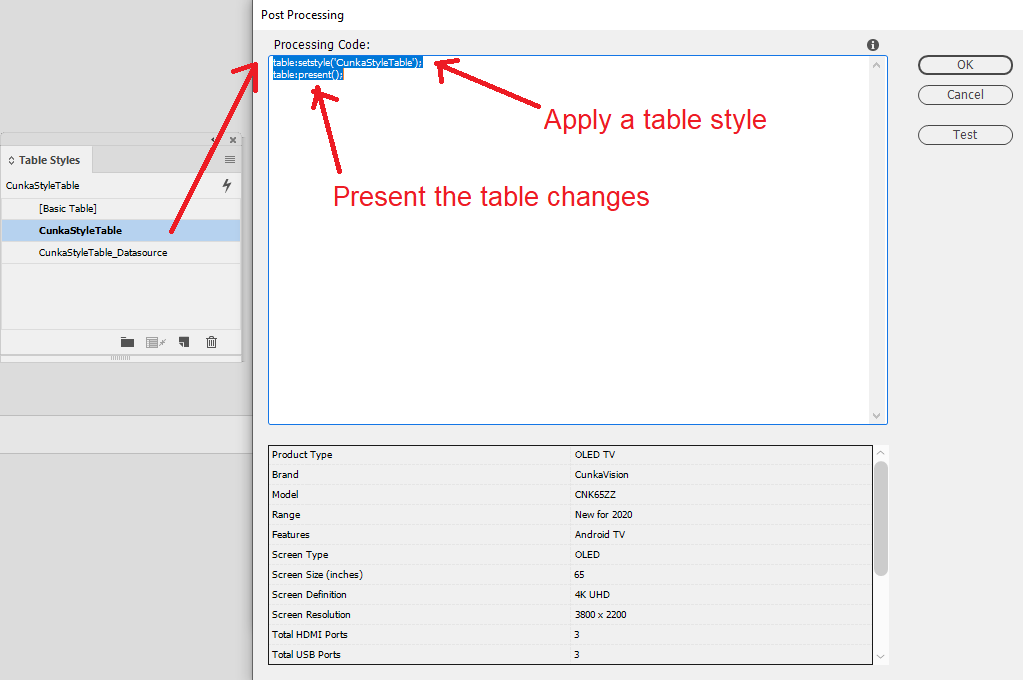
Press the "Additional Processing…" button.
In the Post Processing dialog we can do some additional work on the table. So we will use one of my existing table styles and apply that to the tabular table we have created.
table:setstyle('CunkaStyleTable');
table:present();
Press "OK".
Next we create a text frame and insert a 1 x 1 table.
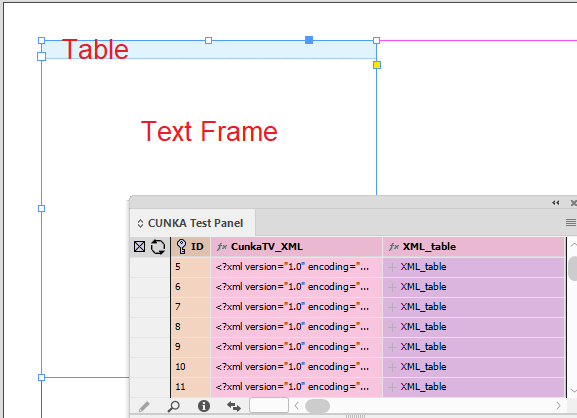
With the table selected we edit the table options and use the following settings.
- Populate Using Tabular Field
- Field
-
XML_table
- Preserve Header
-
Checkbox is not selected.
- Expand
-
Vertically
- When Populating
-
Create New Table
Press "OK".
The transformed XML can now appear in the table.
XML complex table
A ‘complex’ table takes XML data and transforms it using XSL, into a HTML format table. The result can be used to populate an InDesign table.
| This functionality requires the XML Data Provider Module. |
Example
A typical usage would be where the source data contains a XML snippet in a field that needs to be output as a table.
For example each product may have a “cunkaTV” field containing detailed technical specifications about a product. This could be loaded into the field as an “XML Fragment” via the XML Data Provider.
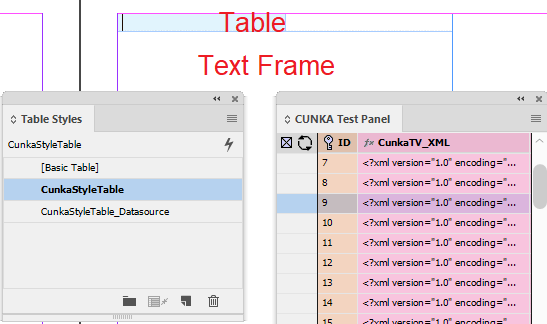
In this example, the XML snippet is loaded into the field CunkaTV_XML.
<?xml version="1.0" encoding="UTF-8" standalone="yes"?>
<cunkaTV>
            <Features attribute1="Product Type" attribute2="OLED TV"/>
            <Features attribute1="Brand" attribute2="CunkaVision"/>
            <Features attribute1="Model" attribute2="CNK65ZZ"/>
            <Features attribute1="Range" attribute2="New for 2020"/>
            <Features attribute1="Features"         attribute2="Android TV"/>
            <Features attribute1="Screen Type"   attribute2="OLED"/>
            <Features attribute1="Screen Size (inches)"  attribute2="65"/>
            <Features attribute1="Screen Definition"      attribute2="4K UHD"/>
            <Features attribute1="Screen Resolution"      attribute2="3800 x 2200"/>
            <Features attribute1="Total HDMI Ports"     attribute2="3"/>
            <Features attribute1="Total USB Ports"         attribute2="3"/>
            <Features attribute1="Power Consumption Sleep"    attribute2="0.5w"/>
            <Features attribute1="Power Consumption(kWh/yr)"          attribute2="620"/>
            <Features attribute1="Width (cm)"    attribute2="145"/>
            <Features attribute1="Depth (cm)"    attribute2="29"/>
            <Features attribute1="Height (cm)"   attribute2="85"/>
            <Features attribute1="Weight (kg)"   attribute2="20.5"/>
            <Features attribute1="Warranty (months)"   attribute2="12"/>
</cunkaTV>
The XML is built up of a a root element called cunkaTV that contains the technical Features elements. Each Features element has an attribute1 and attribute2 fields. Where attribute1 contains the name of the feature, and attribute2 contains the feature value.
On our document page we create a text frame and insert a 1 row x 2 column table.
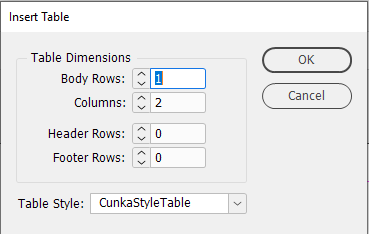
Here is what the table looks like on the page. It has a predefined table style applied.
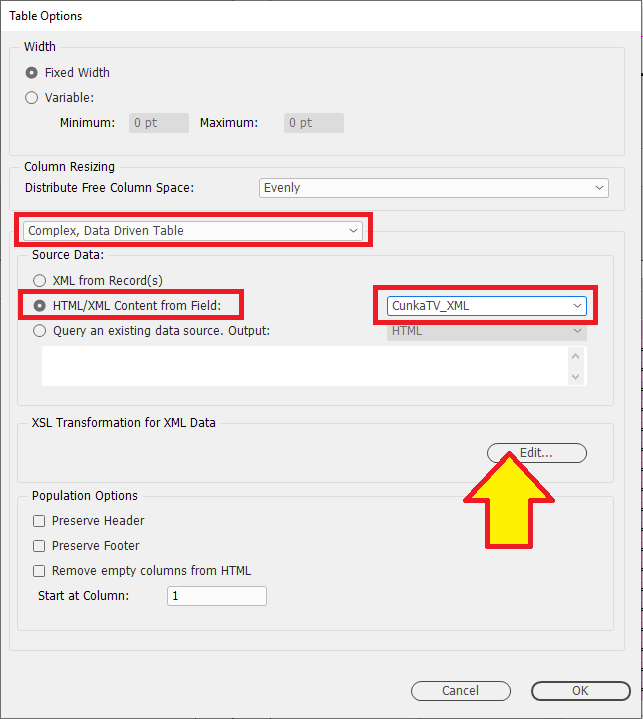
With the table selected, we select Table > Table Options in the panel, we apply the following settings:
- Complex, Data Driven Table
- Source Data
-
HTML/XML Content from Field
CunkaTV_XML
To apply our XSL transformation press "Edit".
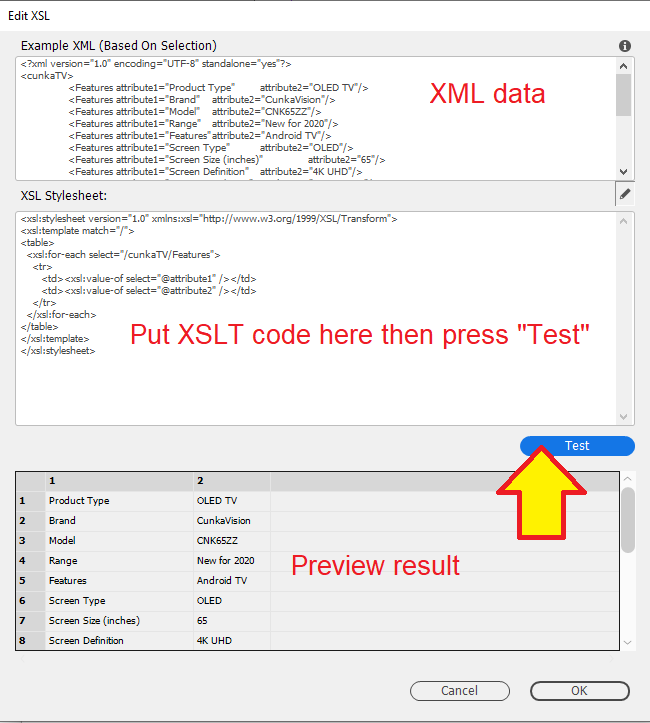
The top window of the Edit XSL dialog has a preview of the XML data.
In the next window called XSL Stylesheet: we put the following XSL transformation code.
<xsl:stylesheet version="1.0" xmlns:xsl="http://www.w3.org/1999/XSL/Transform">
<xsl:template match="/">
<table>
  <xsl:for-each select="/cunkaTV/Features">
    <tr>
       <td><xsl:value-of select="@attribute1" /></td>
       <td><xsl:value-of select="@attribute2" /></td>
    </tr>
  </xsl:for-each>
</table>
</xsl:template>
</xsl:stylesheet>
The XSL simply uses a for-each repeating loop to go over every Features and create columns for each attribute1 and attribute2 to create a HTML table.
Press the "Test" button to see a preview of the table.
Here is the final result where the XML has been transformed into a HTML table and applied to the table.
Matrix Table
What is a Matrix Table?
A matrix table is a ‘look up’ table that expands both horizontally and vertically. They are usually read as the rows as the source, and the columns the destinations. However, its possible to change this around. Train time tables are a good example of a matrix table.
In EasyCatalog, the amount of rows and columns is determined by the number of unique values in the specified fields.
Example 1 - Using the Matrix Table dialog
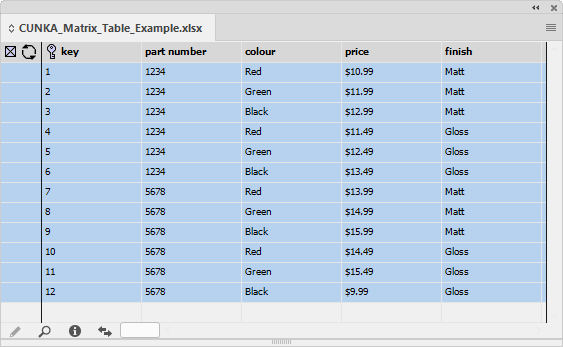
The release of EasyCatalog CC2019 (version 14) saw an improved interface with a new dialog window to assist in creating a matrix table. Through this example we will explore the use of this new dialog which is based of the example given by 65bit.com : https://www.65bit.com/docs/what-is-a-matrix-table/
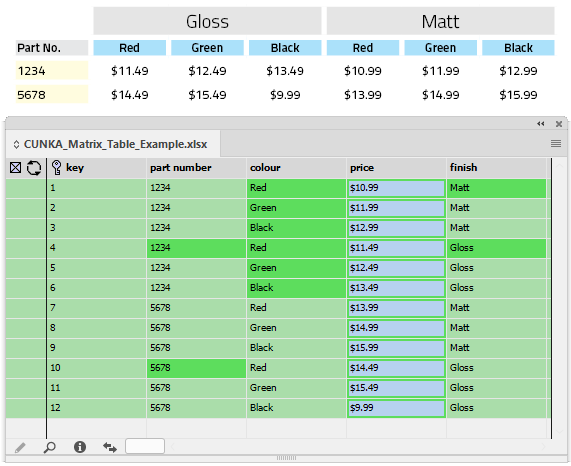
The 2 products are available in 3 ‘colours’, 2 ‘finishes’ (‘Gloss’ and ‘Matt’) and each variant is a slightly different price. The reader can find the finish and colour they’re looking for in the table’s columns, then look down the row for the part number they want to purchase. The price of the item is shown where the column and rows intersect.
With that knowledge, the first step is to design how your table will look.
| Gloss | Matt | |||||
|---|---|---|---|---|---|---|
Part No. |
Red |
Green |
Black |
Red |
Green |
Black |
1234 |
$11.49 |
$12.49 |
$13.49 |
$10.99 |
$11.99 |
$12.99 |
5678 |
$14.49 |
$15.49 |
$9.99 |
$13.99 |
$14.99 |
$15.99 |
We can see that both "FINISH" & "COLOUR" are headings.
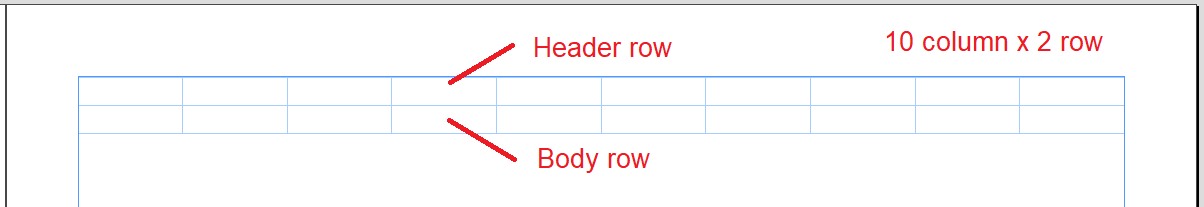
In total we have 3 rows x 2 columns.
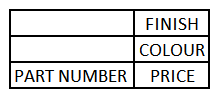
Create a table in InDesign.
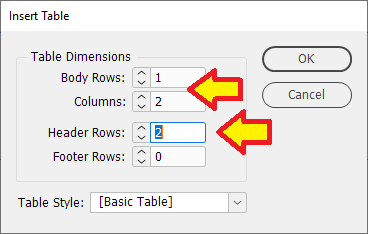
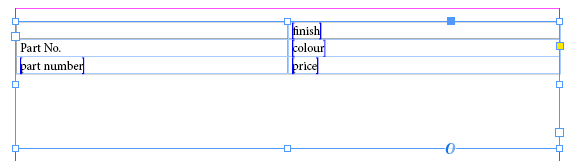
Insert the field specifiers into the table cells. The text "Part No." has been added as a heading to indicate the column the part numbers will appear in.
To test, we make sure all the data to be in the table is selected.
With the cursor placed anywhere in the table itself, we can now select the "Matrix Table Options".
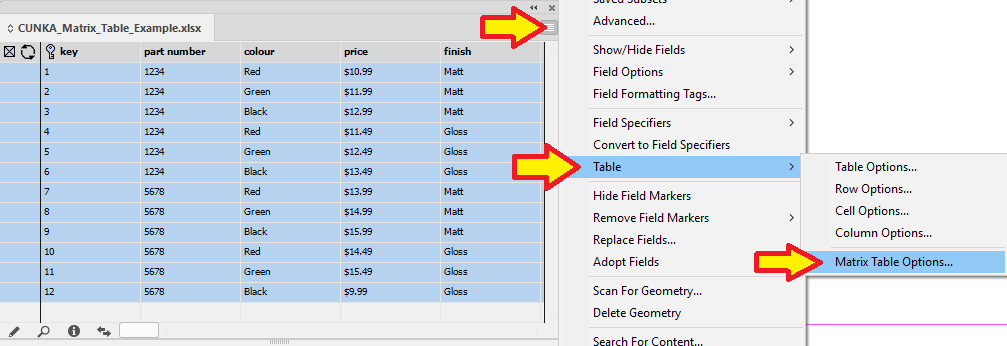
The dialog window below is the default settings for the Matrix Table Options.
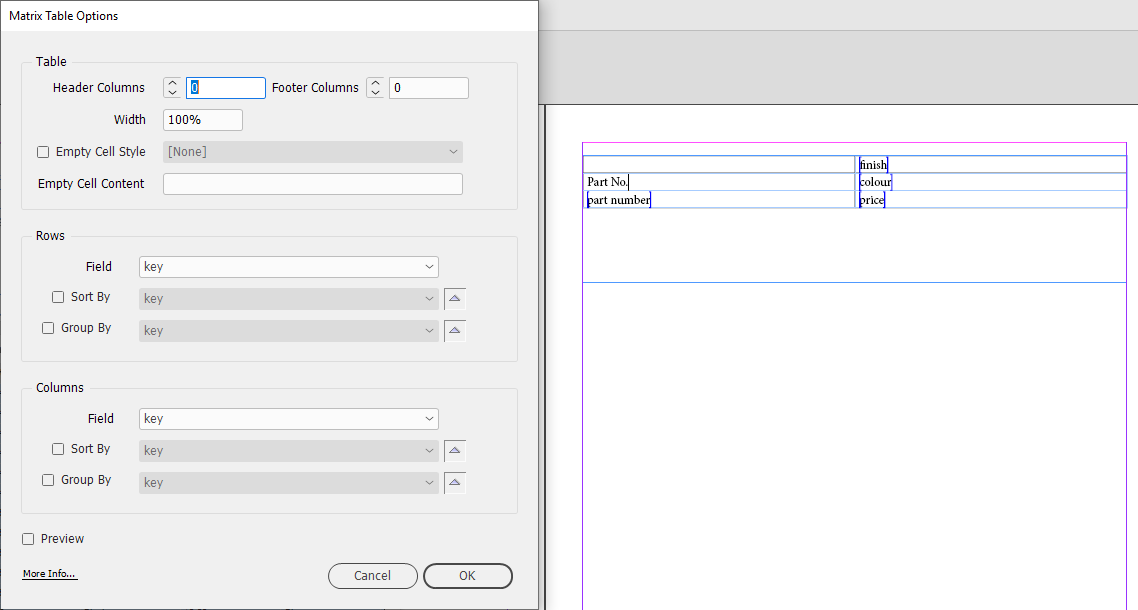
To see the changes happen as you change settings, make sure the Preview checkbox is selected.
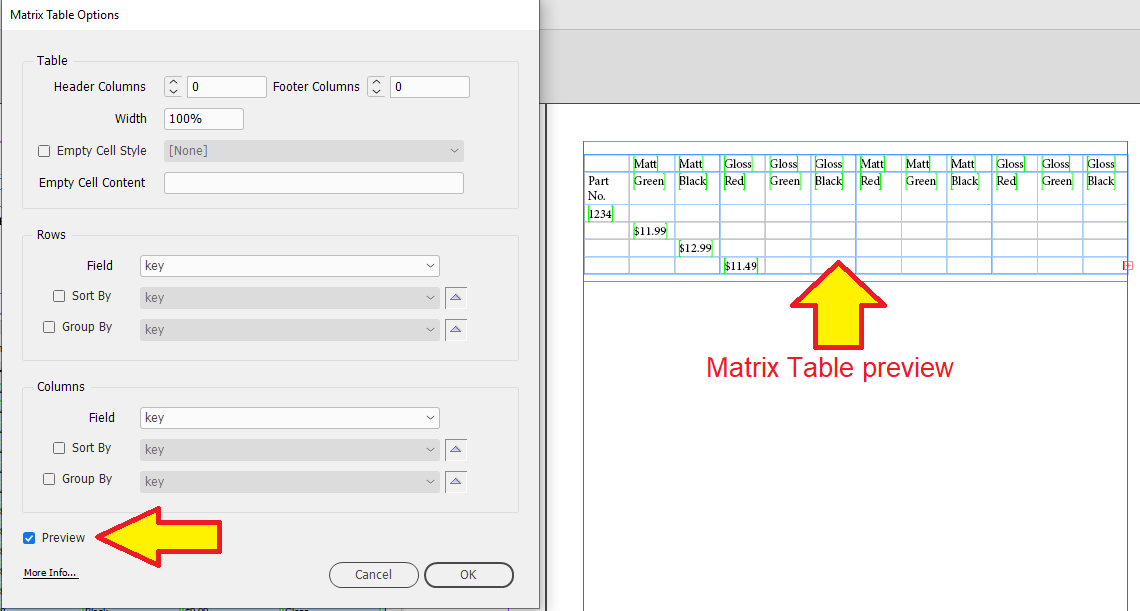
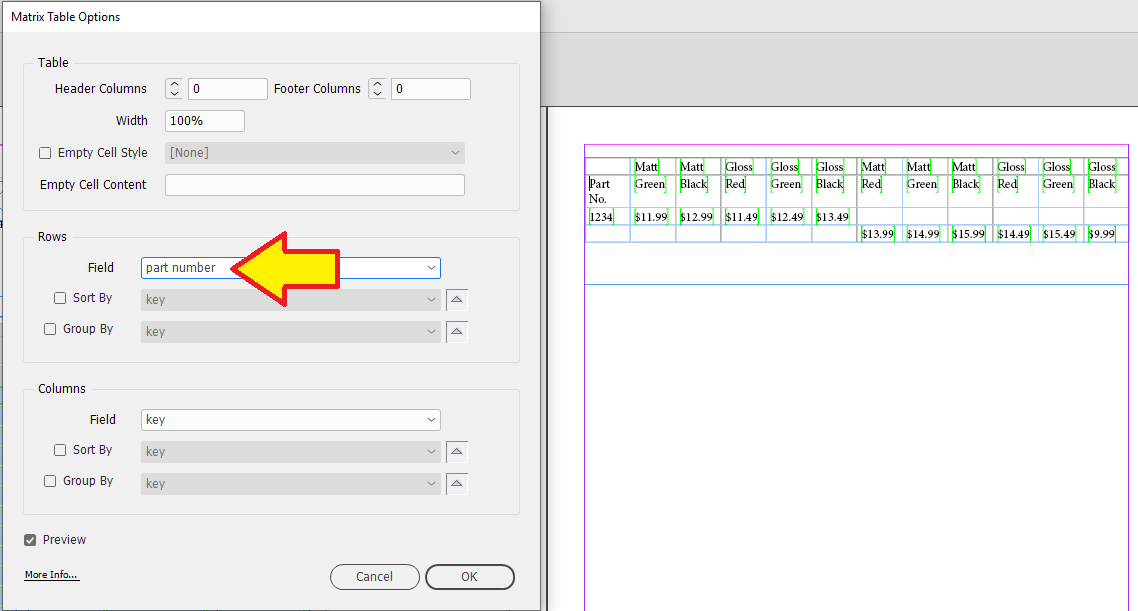
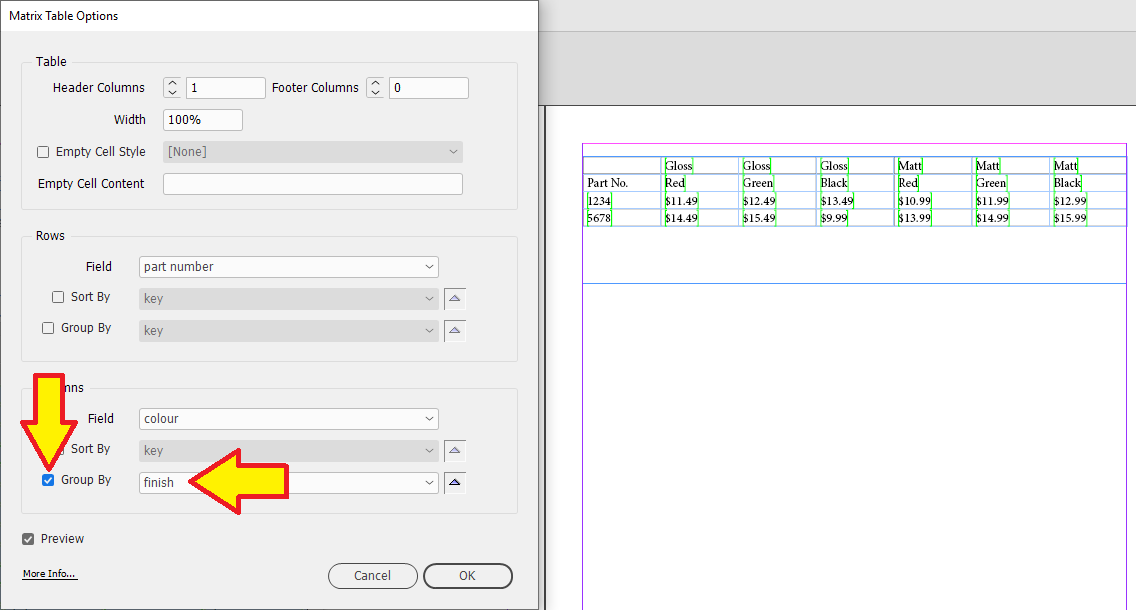
Change the Rows → Field to "part number".
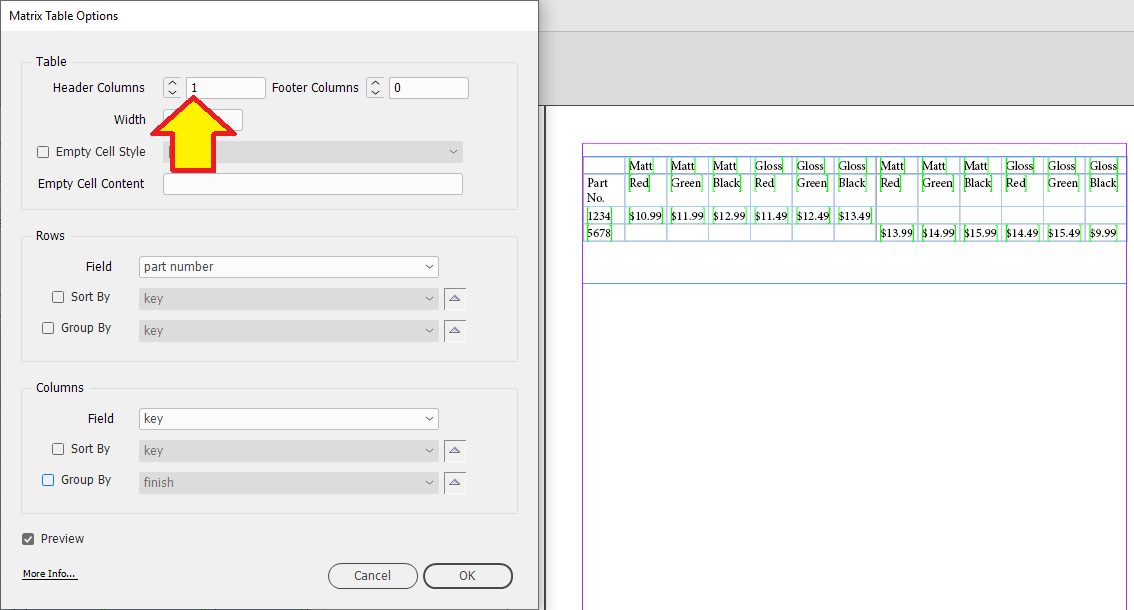
Change the Table → Header Columns to 1.
Change the Columns → Field to "colour".
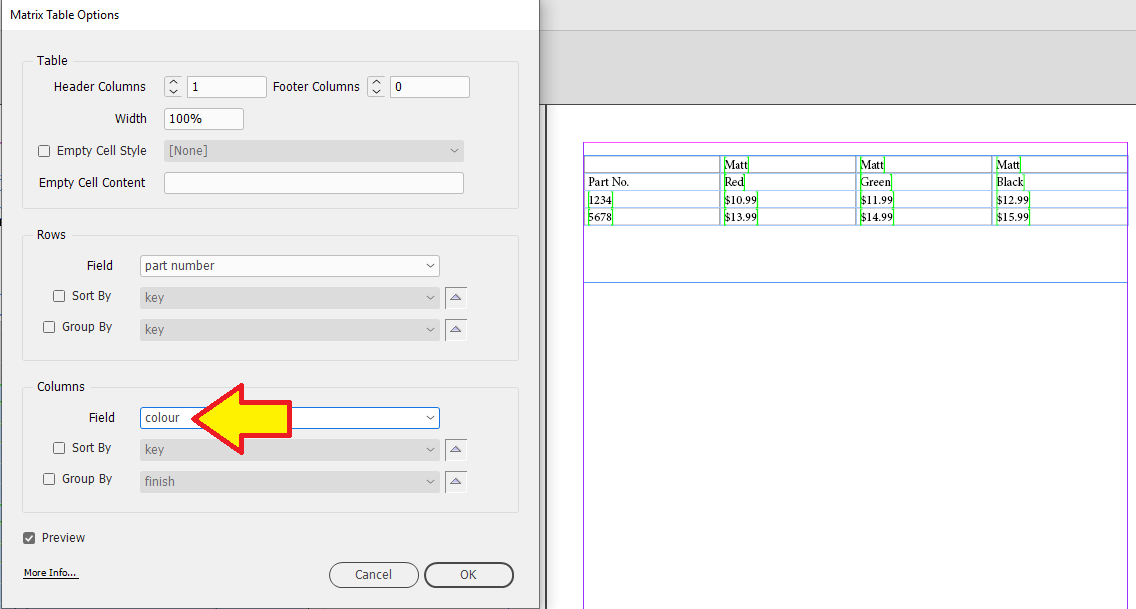
Change the Columns → Group By to "finish".
Now you can see it has come together nicely, but the top row for "Finish" has duplicated the Gloss and Matt settings.
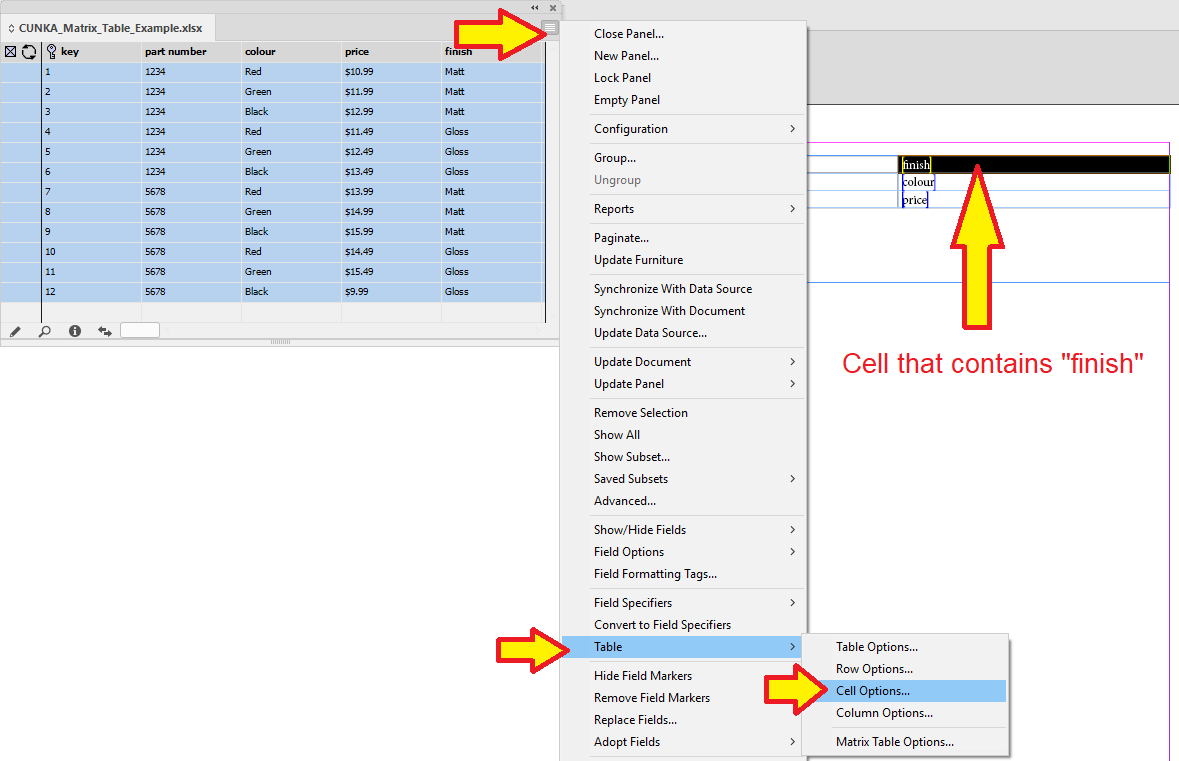
Lets now get those cells to merge.
Click Cancel
With the cursor in the "finish" cell, select Table → Cell Options
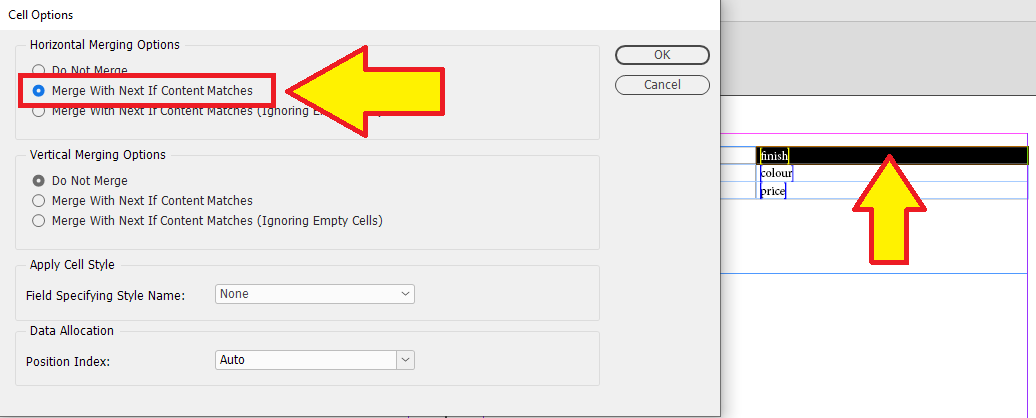
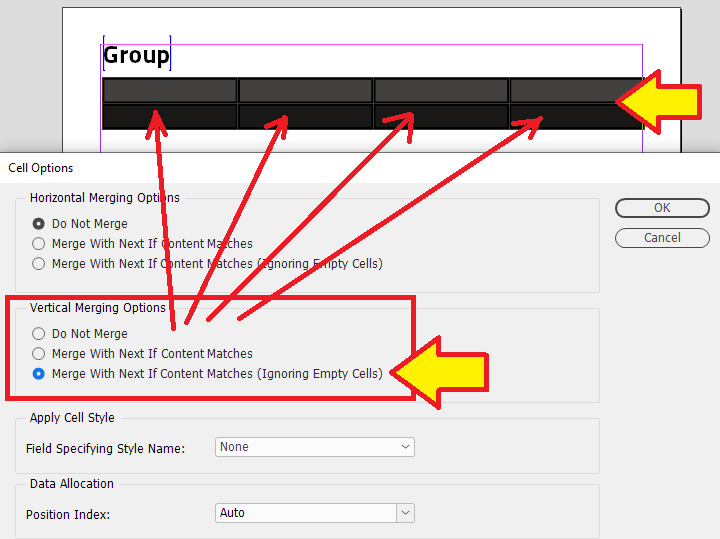
Change the Horizontal Merging Options to _Merge With Next If Content Matches.
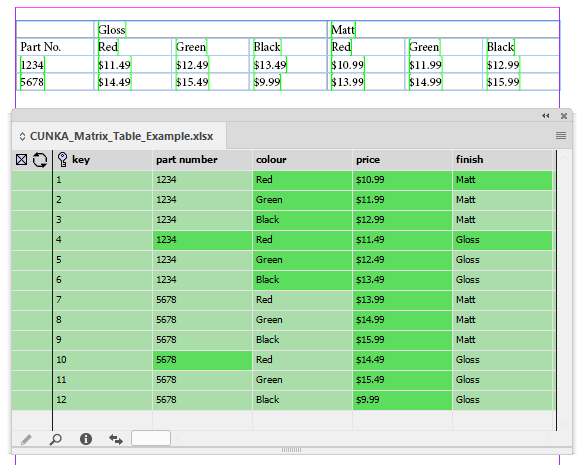
Now when you go back to the Matrix Table Options you will see the table below.
| The screen shot shows the table paginated and what the data source panel looks like. |
Reuse or Create A New Table
When using Tabular Table fields, you get to choose whether to Reuse Existing Table or Create A New Table. The choice used will depend on your data and the amount of flexibility you need in the table.
- Reuse Existing Table
-
Table has already been created with the minimum amount of columns required.
- Create A New Table
-
A new table with basic formatting is created with the amount of columns required. Requires the table style to be set.
Reuse Existing Table
When using Reuse Existing Table you already know what InDesign table style you are using (its possible to change) and the amount of columns in the table.
If the table has only 3 columns and there is 5 columns of data, then 2 columns will not appear.
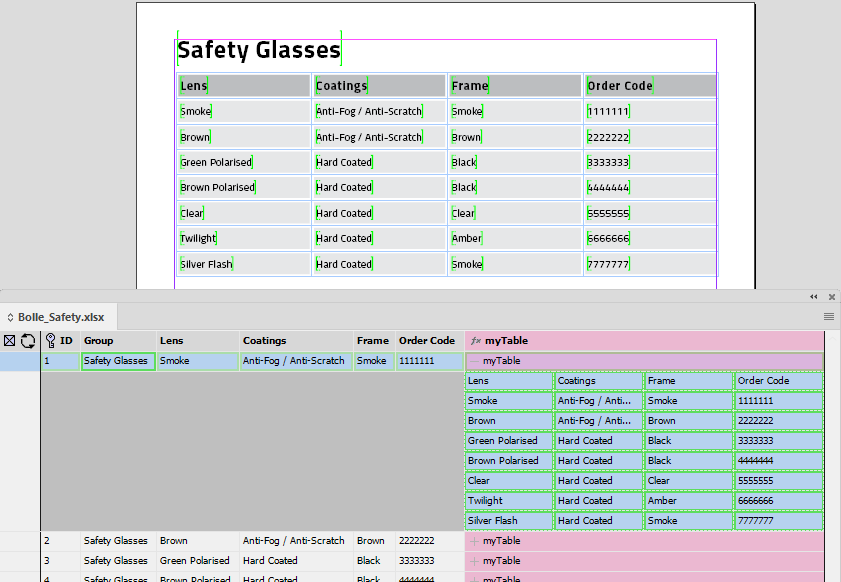
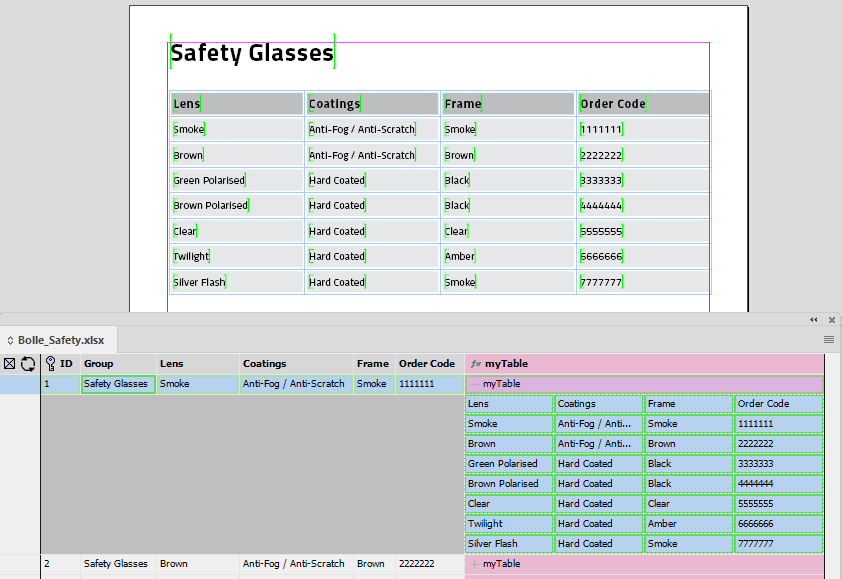
Example - Existing Table
In this example I have a data source panel that has the tabular field myTable already set up to produce a 4 column table with a header row.
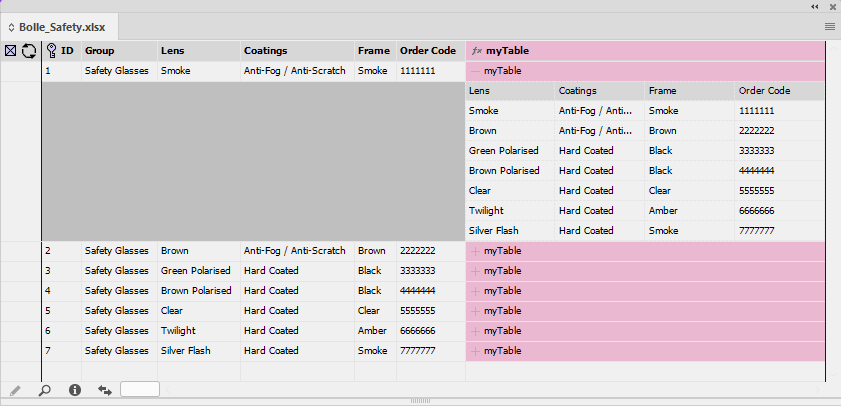
A table inserted into the text frame:
-
1 body row
-
4 columns
-
1 header row
-
Safety_Glasses table style
The created table looks like this on the page.
We have also inserted the field specifier Group above the table as a topic heading.
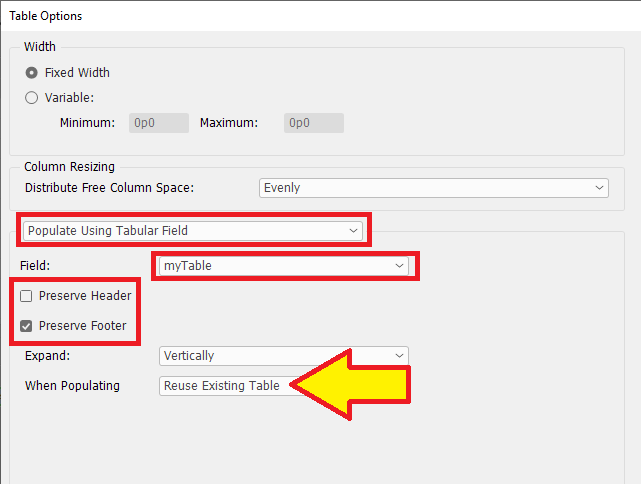
With the table selected , Table > Table Options from the EasyCatalog panel menu we apply the following settings for the table.
- Table Options settings
-
Populate Using Tabular Field
- Field
-
myTable
- Preserve Header
-
Uncheck the box
- Preserve Footer
-
Leave checked (does not make a difference in this example)
- Expand
-
Vertical
- When Populating
-
Reuse Existing Table
If the existing table contained the column headers we would select Preserve Header.
|
The final result.
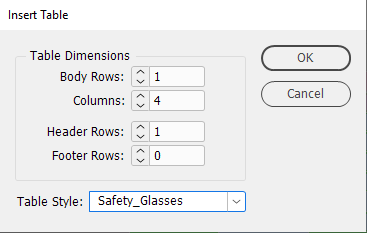
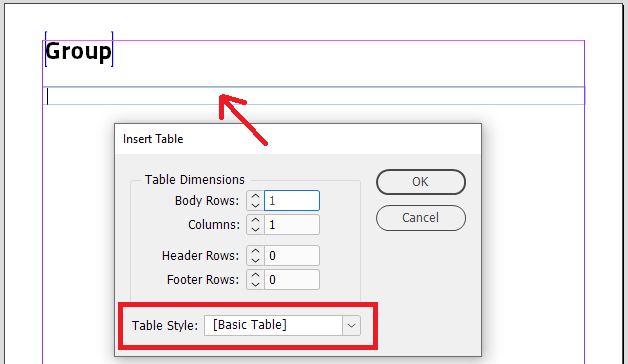
Create A New Table
When you have tables that have variations in the amount of columns, and you would like to control the styling of the table, then Create A New Table is a great choice. However, it does require a bit more work to set up and use.
Example - New Table
In this example I have a data source panel that has the tabular field myTable already set up to produce a 4 column table with a header row.
A table inserted into the text frame:
-
1 body row
-
1 column
-
[Basic Table] table style
Does not matter what Table Style is entered when you "Insert Table". EasyCatalog overrides the table style as it is instructed to Create A New Table.
|
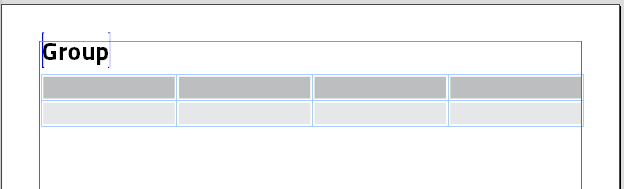
Notice how there is only 1 column?
EasyCatalog will do the hard work and create the columns as they are needed.
We have also inserted the field specifier Group above the table as a topic heading.
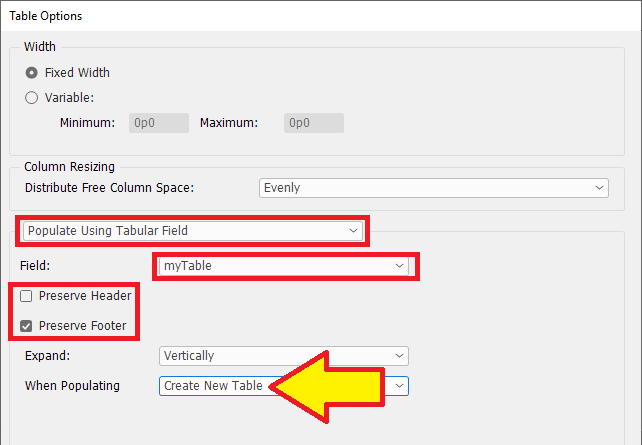
With the table selected , Table > Table Options from the EasyCatalog panel menu we apply the following settings for the table.
- Table Options settings
-
Populate Using Tabular Field
- Field
-
myTable
- Preserve Header
-
Uncheck the box
- Preserve Footer
-
Leave checked (does not make a difference in this example)
- Expand
-
Vertical
- When Populating
-
Create New Table
If the existing table contained the column headers we would select Preserve Header.
|
In the field options for myTable under "Additional Processing" we simply add the LUA code table:setstyle('Safety_Glasses');
This simple instruction tells EasyCatalog after the table is constructed to set the table style to be Safety_Glasses.
table:setstyle('Safety_Glasses');| In a more advanced scenario, we could have the flexibility where we set up a range of styles and conditionally chose which one to use defined by our data. |
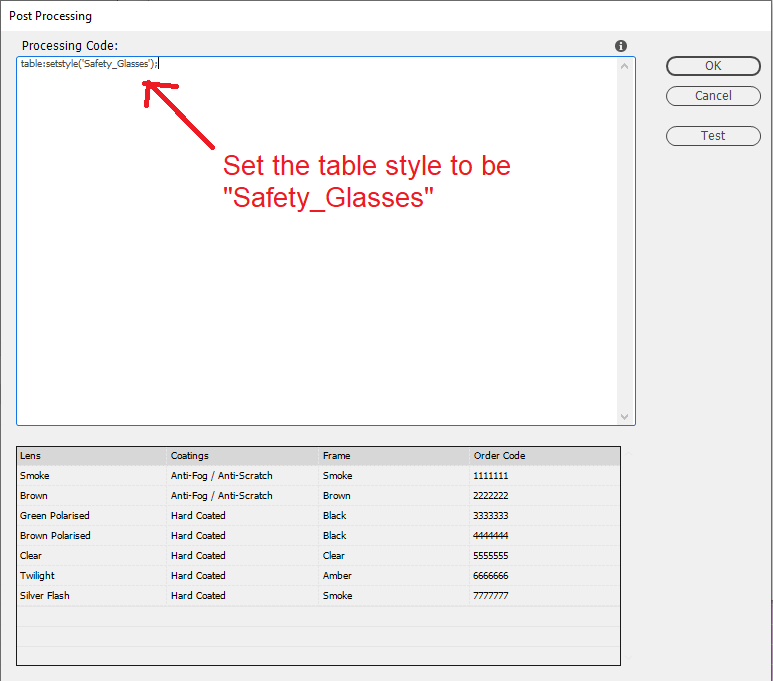
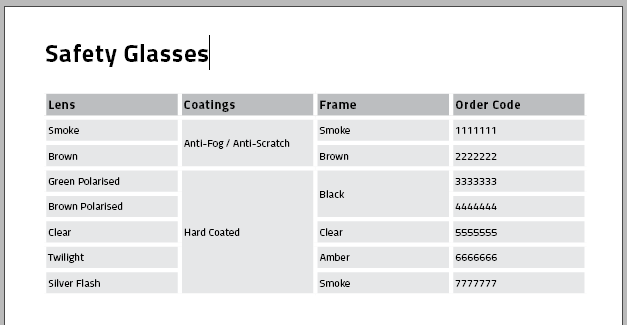
The final result.
Merge Table Cells
Data in tables can sometimes be repeated in adjacent horizontal or vertical cells. As a designer, you may want to merge these cells and use one value for presentation.
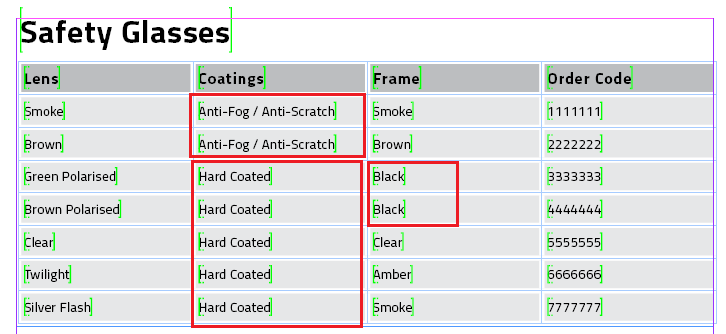
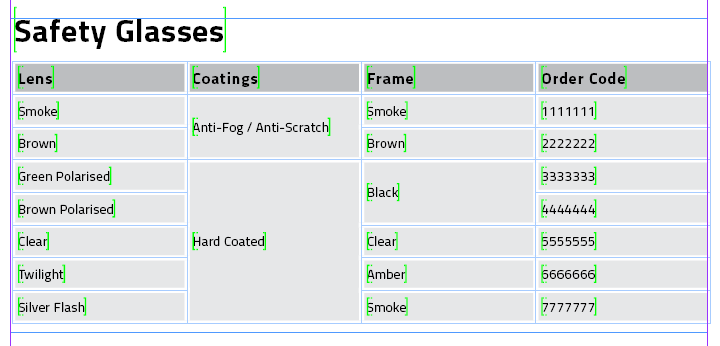
In EasyCatalog, how and when to use the merge cell option is determined by the table created.
Tables can either pre-exist, or be created new at pagination time. Both however require different methods to apply the merging of table cells.
Pre-Existing Table
With a pre-existing table select Table Options > Cell Options.
You can then define all the cells or a range of cells preset behaviours like Horizontal Merging or Vertical Merging.
By default both Horizontal Merging and Vertical Merging are set to Do Not Merge.
New Table
New tables (usually from tabular fields) require some additional processing to merge cells. Since the table is new, EasyCatalog/InDesign has no idea how you want the cells to be handled. So some simple reusable LUA code is used.
Through the "Additional Processing" (Post Processing) dialog its possible to do anything you need to a table through LUA code.
This LUA code for instance simply takes all the cells across all the columns except the first row (which is a header), and does a verticalmerge on the condition ifcontentmatches.
It then sets the InDesign table style I have created called Safety_Glasses, to be the style of the table.
for r = 2,table:rowcount() do
	for c = 1,table:colcount() do
		table:cell(r,c):setmergeoption('verticalmerge','ifcontentmatches');
	end
end

table:setstyle('Safety_Glasses');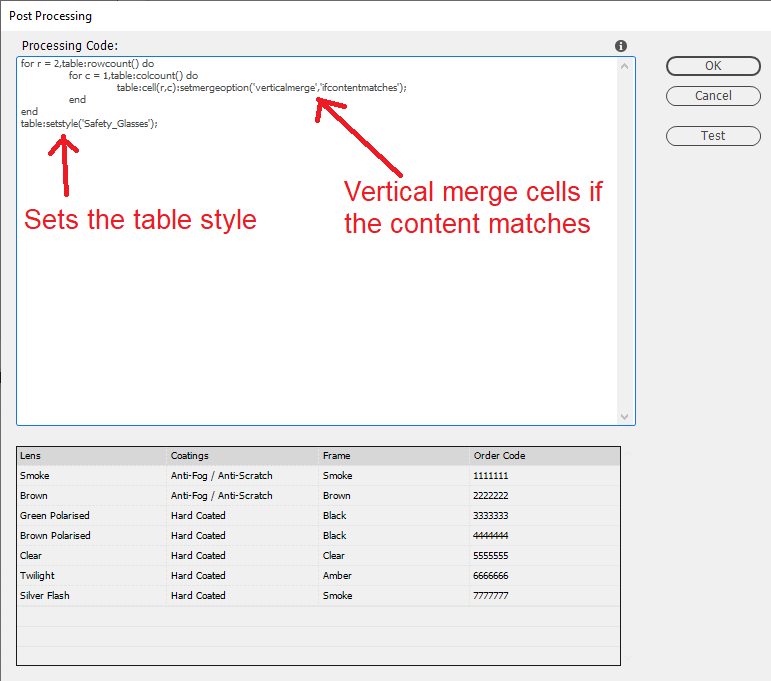
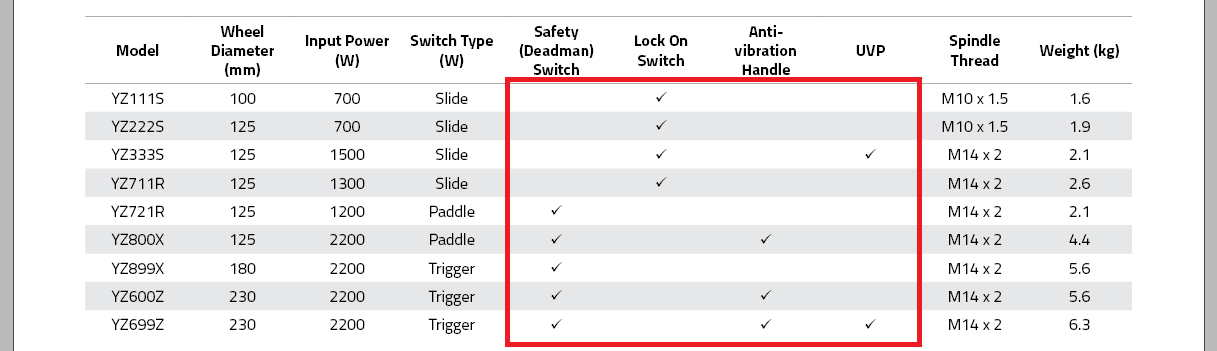
Quick Selection Table
Overview
The Quick Selection Table (or the Quick Reference Table) is a type of table that conveys information so the reader can easily make a decision.
Tables can sometimes appear with a dense amount of data with much of the information somewhat repeated through repetition or similarities.
- A Quick Selection Table must
-
-
FILTER — scope of data is reduced to only what needs to be shown.
-
SORT — data is presented in an order. This is done through determining the most important attribute(s). eg. catalogue number, price, weight, size…
-
- The reader can easily
-
-
SCAN
-
ANALYZE
-
COMPARE
-
As a designer, you will know that information can be cleaned up and presented that enhances the readers experience.
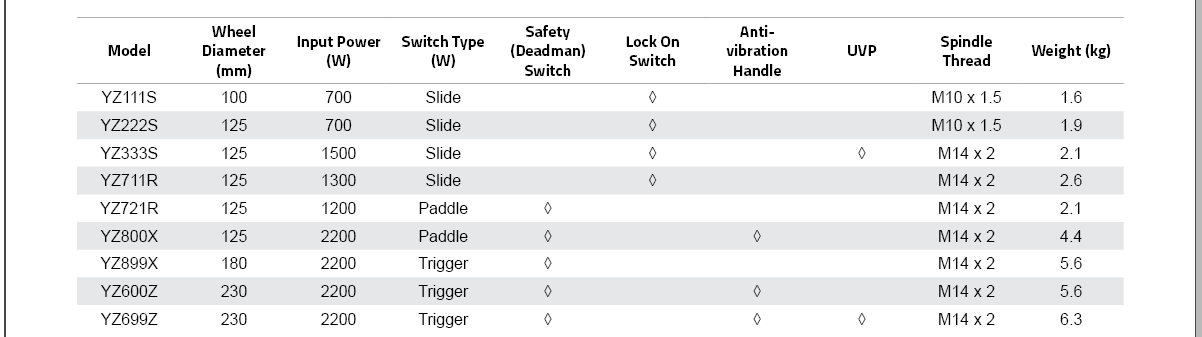
With Quick Selection Tables you will see (as an example) a lot of Yes/No attributes in a table. A designer can quickly turn those columns graphically into a cleaner table where the user can scan,analyze, compare with ease.
Preparation
| At CUNKA we design our table styles, cell styles, paragraph styles in advance. |
Before attempting a Quick Selection Table, always have a mockup of how you would like tables to appear. While it may seem obvious, you will surprised at how often it can make the work take longer then it should if it is not done.
If you are replacing text with characters like ticks, crosses, circles, boxes, hollowed shapes, then always know what font you plan to use and importantly what unicode number is used for that character.
The InDesign Glyphs panel is a handy tool to work out the numbers of unicode characters.
Examples
|
All the following examples use a custom tabular field and LUA code. Examples 1- 4 create a new table. Example 5 uses an existing table. |
The examples all begin looking like the preview in this screen shot.
Example 1 - Full bullet style circle
-
Font: Arial
-
Unicode: 25CF
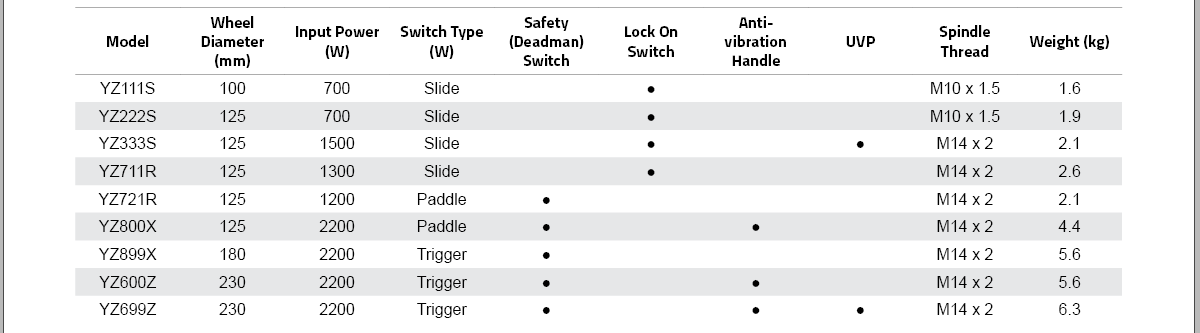
table:setstyle('CUNKA_Table_Style');

col1 = table:getcolindex(1,'Safety (Deadman) Switch');
table:setcolcleansing(col1, "No", "");
table:setcolcleansing(col1, "Yes", "\\x{25CF}");

col2 = table:getcolindex(1,'Lock On Switch');
table:setcolcleansing(col2, "No", "");
table:setcolcleansing(col2, "Yes", "\\x{25CF}");

col3 = table:getcolindex(1,'Anti-vibration Handle');
table:setcolcleansing(col3, "No", "");
table:setcolcleansing(col3, "Yes", "\\x{25CF}");

col4 = table:getcolindex(1,'UVP');
table:setcolcleansing(col4, "No", "");
table:setcolcleansing(col4, "Yes", "\\x{25CF}");

table:setrowstyle(1, "Header");

return table:present();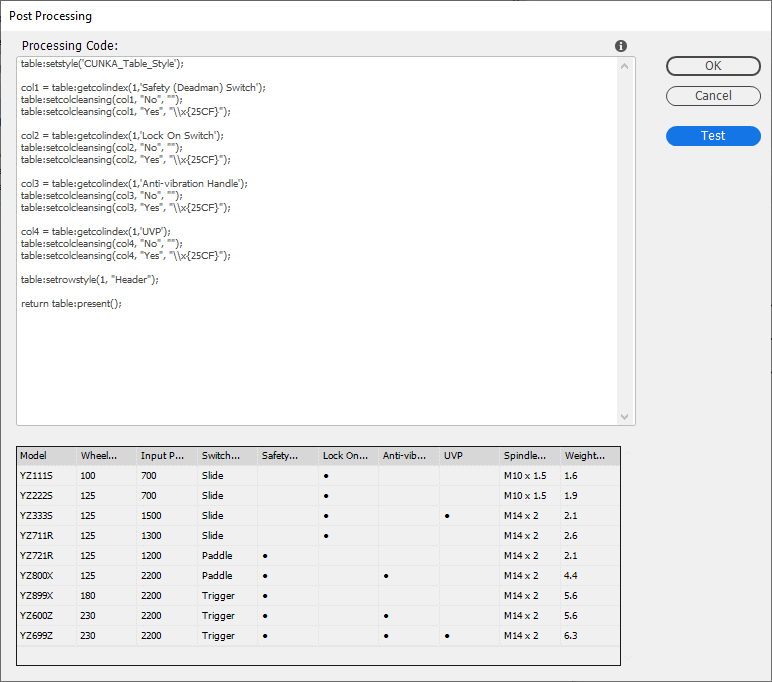
Example 2 - Hollow bullet style circle
-
Font: Arial
-
Unicode: 25CB
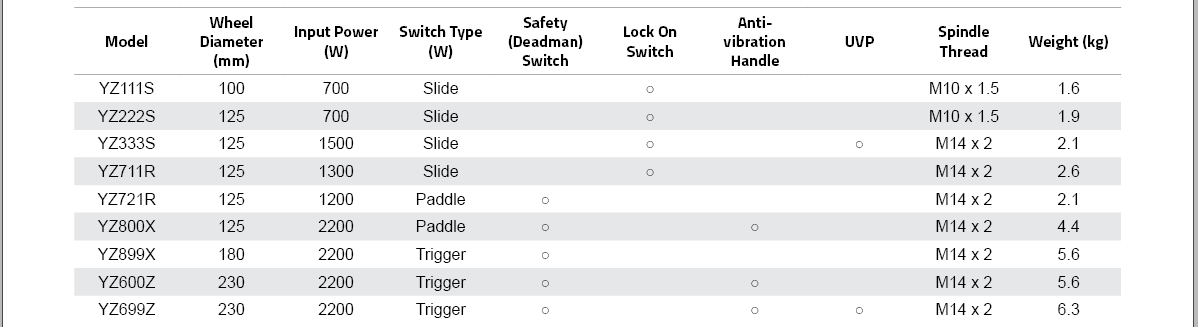
table:setstyle('CUNKA_Table_Style');

col1 = table:getcolindex(1,'Safety (Deadman) Switch');
table:setcolcleansing(col1, "No", "");
table:setcolcleansing(col1, "Yes", "\\x{25CB}");

col2 = table:getcolindex(1,'Lock On Switch');
table:setcolcleansing(col2, "No", "");
table:setcolcleansing(col2, "Yes", "\\x{25CB}");

col3 = table:getcolindex(1,'Anti-vibration Handle');
table:setcolcleansing(col3, "No", "");
table:setcolcleansing(col3, "Yes", "\\x{25CB}");

col4 = table:getcolindex(1,'UVP');
table:setcolcleansing(col4, "No", "");
table:setcolcleansing(col4, "Yes", "\\x{25CB}");

table:setrowstyle(1, "Header");

return table:present();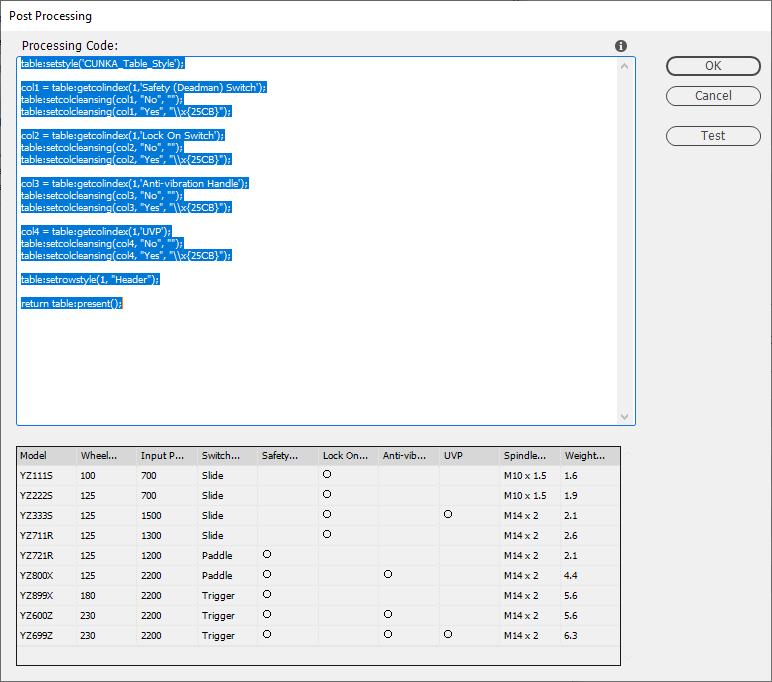
Example 3 - Full square
-
Font: Arial
-
Unicode: 25A0
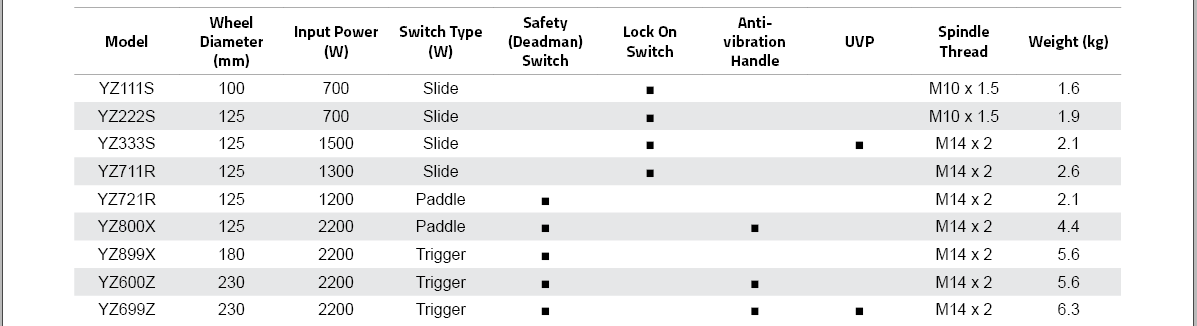
table:setstyle('CUNKA_Table_Style');

col1 = table:getcolindex(1,'Safety (Deadman) Switch');
table:setcolcleansing(col1, "No", "");
table:setcolcleansing(col1, "Yes", "\\x{25A0}");

col2 = table:getcolindex(1,'Lock On Switch');
table:setcolcleansing(col2, "No", "");
table:setcolcleansing(col2, "Yes", "\\x{25A0}");

col3 = table:getcolindex(1,'Anti-vibration Handle');
table:setcolcleansing(col3, "No", "");
table:setcolcleansing(col3, "Yes", "\\x{25A0}");

col4 = table:getcolindex(1,'UVP');
table:setcolcleansing(col4, "No", "");
table:setcolcleansing(col4, "Yes", "\\x{25A0}");

table:setrowstyle(1, "Header");

return table:present();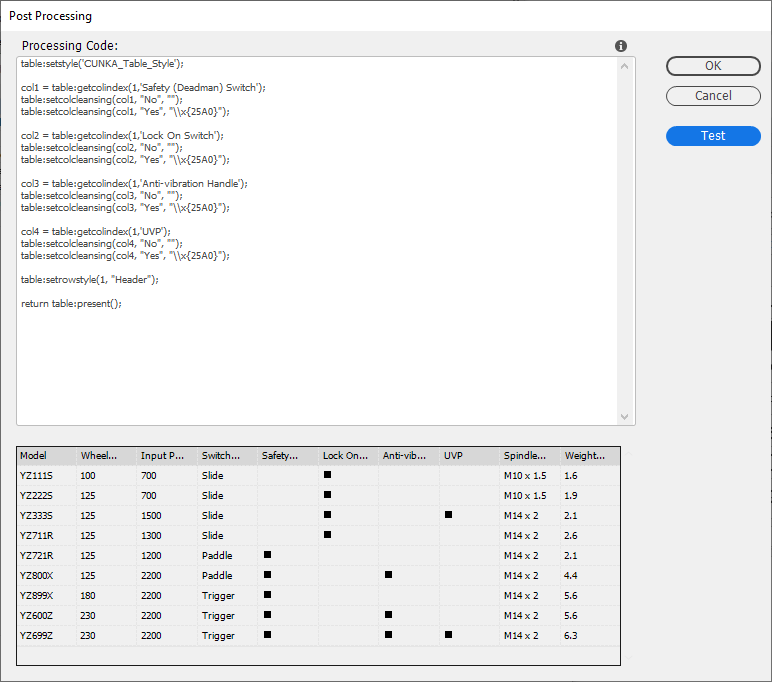
Example 3 - Using hatching
-
Font: Arial
-
Unicode: 2593
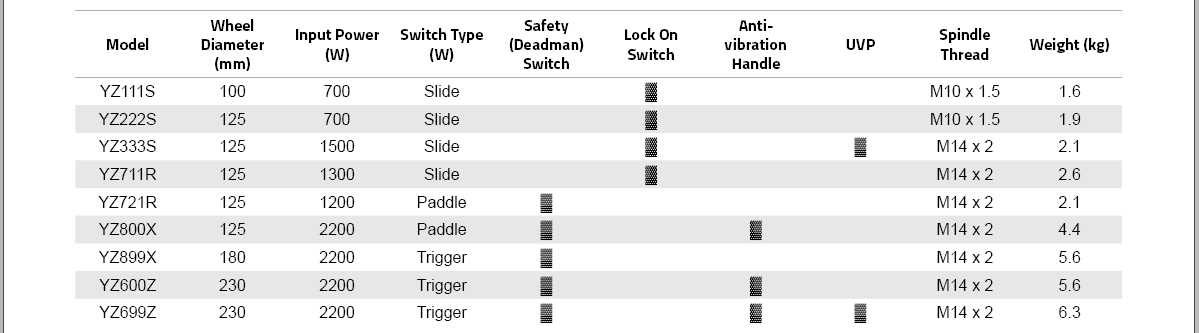
table:setstyle('CUNKA_Table_Style');

col1 = table:getcolindex(1,'Safety (Deadman) Switch');
table:setcolcleansing(col1, "No", "");
table:setcolcleansing(col1, "Yes", "\\x{2593}");

col2 = table:getcolindex(1,'Lock On Switch');
table:setcolcleansing(col2, "No", "");
table:setcolcleansing(col2, "Yes", "\\x{2593}");

col3 = table:getcolindex(1,'Anti-vibration Handle');
table:setcolcleansing(col3, "No", "");
table:setcolcleansing(col3, "Yes", "\\x{2593}");

col4 = table:getcolindex(1,'UVP');
table:setcolcleansing(col4, "No", "");
table:setcolcleansing(col4, "Yes", "\\x{2593}");

table:setrowstyle(1, "Header");

return table:present();
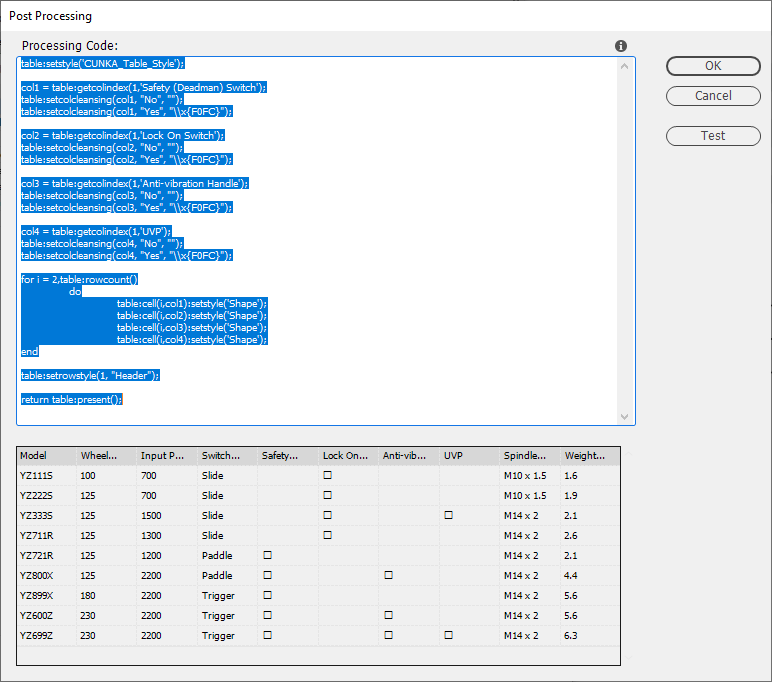
Example 4 - Ticks (using another style)
-
Font: Wing Dings 1
-
Unicode: F0FC
Certain columns have had there cell styles replaced with one called "Shape" from the LUA code. The Shape cell style contains the tick character used in the table to replace the "Yes" text.
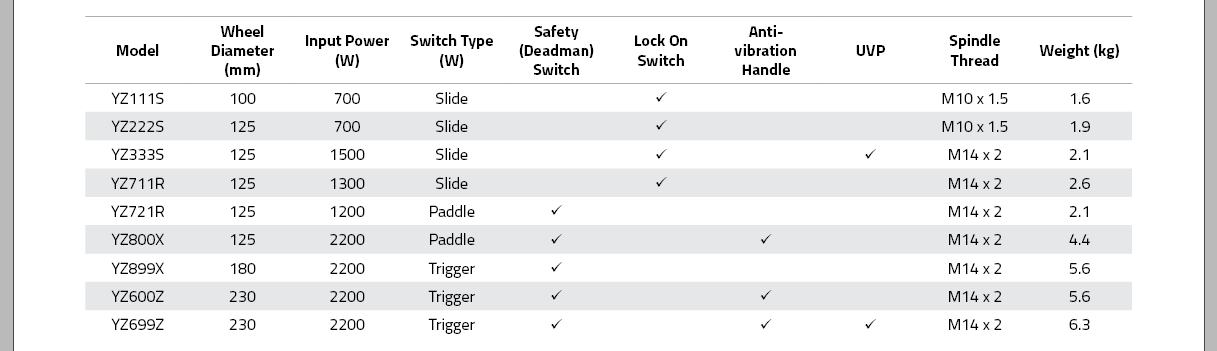
table:setstyle('CUNKA_Table_Style');

col1 = table:getcolindex(1,'Safety (Deadman) Switch');
table:setcolcleansing(col1, "No", "");
table:setcolcleansing(col1, "Yes", "\\x{F0FC}");

col2 = table:getcolindex(1,'Lock On Switch');
table:setcolcleansing(col2, "No", "");
table:setcolcleansing(col2, "Yes", "\\x{F0FC}");

col3 = table:getcolindex(1,'Anti-vibration Handle');
table:setcolcleansing(col3, "No", "");
table:setcolcleansing(col3, "Yes", "\\x{F0FC}");

col4 = table:getcolindex(1,'UVP');
table:setcolcleansing(col4, "No", "");
table:setcolcleansing(col4, "Yes", "\\x{F0FC}");

for i = 2,table:rowcount()
	do
		table:cell(i,col1):setstyle('Shape');
		table:cell(i,col2):setstyle('Shape');
		table:cell(i,col3):setstyle('Shape');
		table:cell(i,col4):setstyle('Shape');
end

table:setrowstyle(1, "Header");

return table:present();
Be aware that the preview may not appear to be correct due to the font used in the Indesign UI.
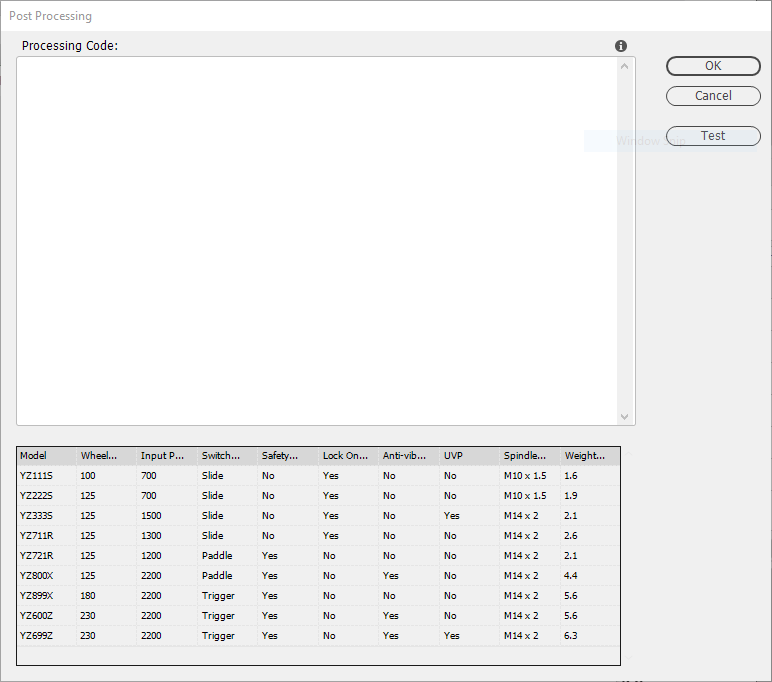
Example 5- Hollow diamond (re-using an existing table)
-
Font: Arial
-
Unicode: F0FC
This example uses an existing table that has the right amount of columns.
col1 = table:getcolindex(1,'Safety (Deadman) Switch');
table:setcolcleansing(col1, "No", "");
table:setcolcleansing(col1, "Yes", "\\x{25CA}");

col2 = table:getcolindex(1,'Lock On Switch');
table:setcolcleansing(col2, "No", "");
table:setcolcleansing(col2, "Yes", "\\x{25CA}");

col3 = table:getcolindex(1,'Anti-vibration Handle');
table:setcolcleansing(col3, "No", "");
table:setcolcleansing(col3, "Yes", "\\x{25CA}");

col4 = table:getcolindex(1,'UVP');
table:setcolcleansing(col4, "No", "");
table:setcolcleansing(col4, "Yes", "\\x{25CA}");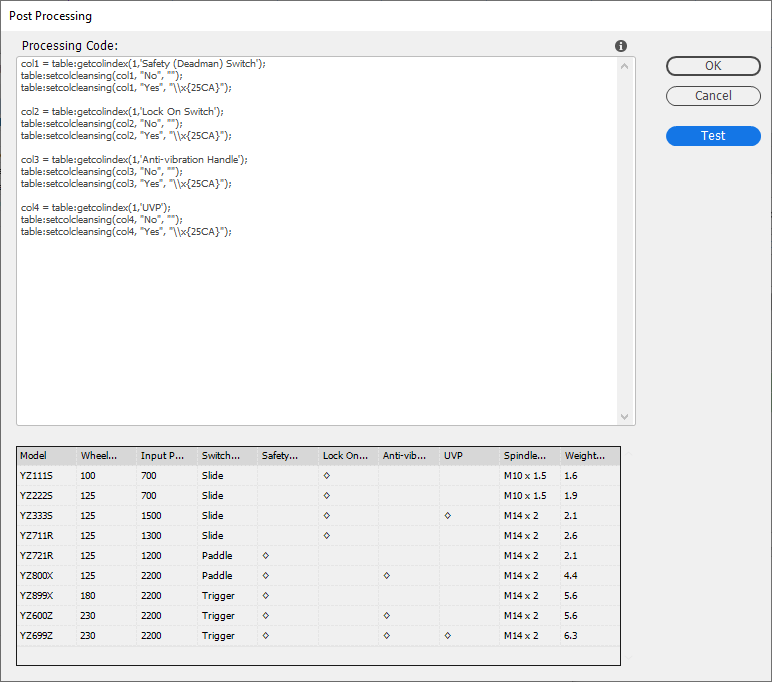
Getting Help
Brian Cowell can be contacted at contact@cunka.com
You can go directly to the creators of EasyCatalog : EasyCatalog Support Page
©2019 Brian Cowell